21 IPython Notebook tutorials for data science, with interactive graphs
61 views
Skip to first unread message

Matt Sundquist
Jun 24, 2015, 1:00:55 PM6/24/15
to pyd...@googlegroups.com
Hi all,
My name is Matt, and I work for Plotly. We've recently published a number of IPython Notebook tutorials with code and examples on how to plot with pandas, matplotlib, and Plotly's Python API. Our goal is to put together a useful gallery for data science, as we've gotten pretty excited about how you can use the NB with pandas and Python. The idea is to make interactive, D3.js graphs in a Notebook:
For other examples of plotting with IPython widgets, connecting to a database, making dashboards, and using pandas with Plotly, you might enjoy our data science blog:
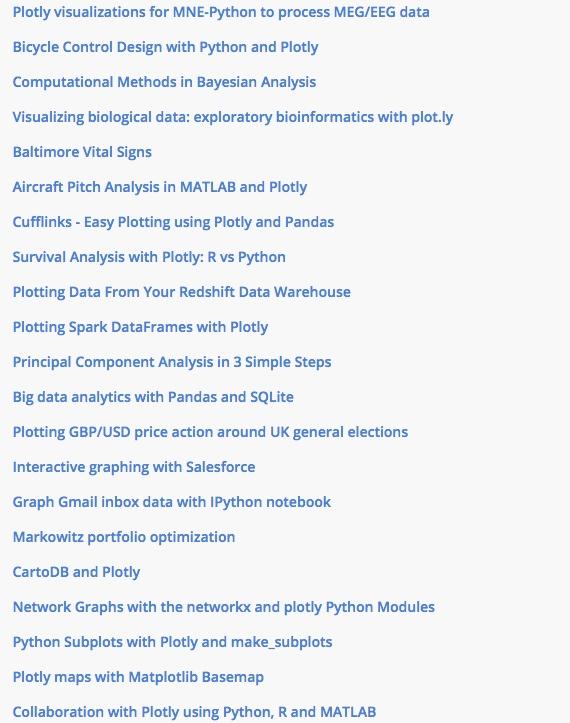
Attached is an image with some of the tutorial topics. I thought I'd pass this along. We'd love any feedback or thoughts, and welcome any of your Notebooks if you want to add any.
Matt
Reply all
Reply to author
Forward
0 new messages