Offline analyzing
16 views
Skip to first unread message

Roni Segoly
Jun 14, 2015, 1:13:40 AM6/14/15
to plots-spe...@googlegroups.com
Are there any offline tools which can analyze spectrum from given picture?

Jeffrey Warren
Jun 15, 2015, 7:54:14 PM6/15/15
to plots-spe...@googlegroups.com
Hi Roni - I think I've seen people use MATLAB, for example -- and of course once you download the JSON or CSV or XML, you can use Excel and many other tools. What kind of analysis are you looking to do?
On Sat, Jun 13, 2015 at 10:13 PM, Roni Segoly <roni....@gmail.com> wrote:
Are there any offline tools which can analyze spectrum from given picture?
--
Post to this group at plots-sp...@googlegroups.com
Public Lab mailing lists (http://publiclab.org/lists) are great for discussion, but to get attribution, open source your work, and make it easy for others to find and cite your contributions, please publish your work at http://publiclab.org
---
You received this message because you are subscribed to the Google Groups "plots-spectrometry" group.
To unsubscribe from this group and stop receiving emails from it, send an email to plots-spectrome...@googlegroups.com.
For more options, visit https://groups.google.com/d/optout.
Roni Segoly
Jun 15, 2015, 10:57:30 PM6/15/15
to plots-spe...@googlegroups.com
The kits I ordered are in Israel, and I will I will get it tomorrow, so my understanding is based on what I played on site what I read
The input for the system is the file, which is uploaded manually and uploaded to site, or captured using the Interface on site, and then the file is analyzed, displayed and numeric data representing the spectrum can be exported and downloaded. These is the data I need,
but I meed to
1. Automate the process from the point when the picture is captured till I get the numeric data
or
2. Have simple tool which can analyze the picture offline, and produce same numeric data. Tool I can feed with picture and get the data. The tool can be online.
One usage I plan for, is to have for children experiment kit, which will measure data from various sensors, and they will be able to plan experiments and share the data.
For example my kit will measure light level and temperature (easy using today Arduino) and also light spectrum, and they can use to test different street lights and different aspects of light pollution
So what I look for is automating the process, once I have the numeric data for site I can make it accessible to the children with the other data
You received this message because you are subscribed to a topic in the Google Groups "plots-spectrometry" group.
To unsubscribe from this topic, visit https://groups.google.com/d/topic/plots-spectrometry/TZ43bV7wh3E/unsubscribe.
To unsubscribe from this group and all its topics, send an email to plots-spectrome...@googlegroups.com.

Amir Bernat
Jun 16, 2015, 5:15:01 AM6/16/15
to plots-spe...@googlegroups.com
Hi Rony,
I'm also from Kfar Saba, could try and see if I can help. I guess the nice people in th PL will do they're best to assist, but as open code goes: if you want something which is doesn't exist, make it yourself (then share).
Amir
Roni Segoly
Jun 16, 2015, 5:32:45 AM6/16/15
to plots-spe...@googlegroups.com
Amit, can we talk? 0546466264
Roni Segoly
Jun 16, 2015, 5:54:48 AM6/16/15
to plots-spe...@googlegroups.com
And regarding the issue I asked about, I'm trying to establish what is available and then will need to develop the missing parts. What ever I will develop I will of course share
On Tue, 16 Jun 2015 12:15 Amir Bernat <ami...@gmail.com> wrote:
Amir Bernat
Jun 16, 2015, 3:19:35 PM6/16/15
to plots-spe...@googlegroups.com
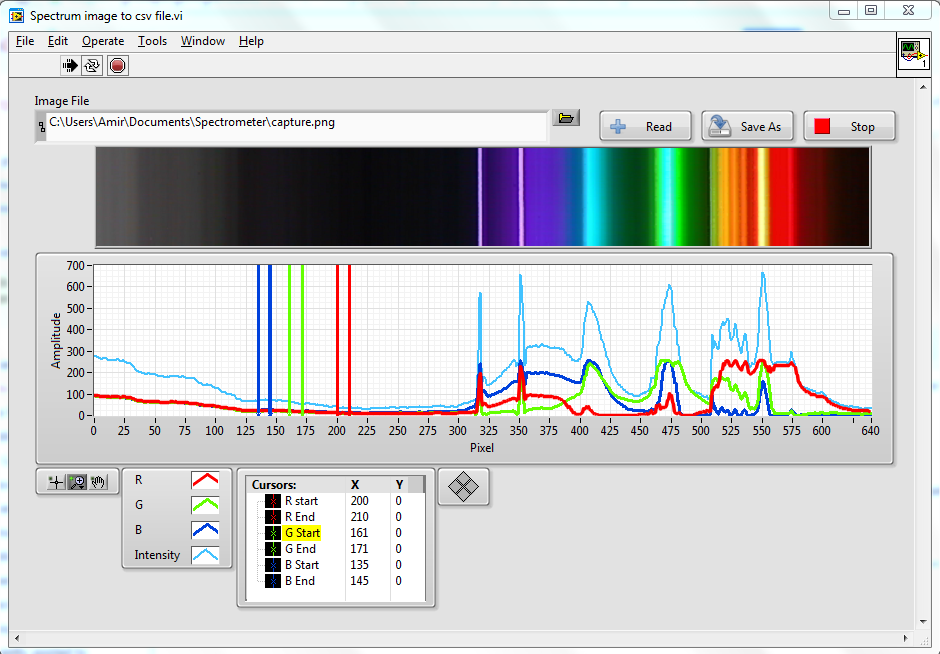
Hey Rony, it's been a long day at work, will try to call in the coming days, probably over the weekend. I've made a small LabVIEW code (ataced here is a link to the exe file compilation) for analyzing spectrum offline. it's very rudimentary but you can easily use it for offline work.
SW link (~1.1 MB):
I have downloaded a file from the SpectralWorkbench as an example:
you will also need to download and install LabVIEW runtime engine (~500 MB):
Once you do so open the exe file, in it, you can brows for jpg or png files, see them as intensity graph (+RGB data) and save them as csv file (placed the headers at the end of file will be fixed in the next release). I will work on adding other functions similar to the web interface (mainly calibration) when I have the time and based on feedback from members here.
Amir
To unsubscribe from this group and all its topics, send an email to plots-spectrometry+unsub...@googlegroups.com.
Roni Segoly
Jun 17, 2015, 12:29:54 AM6/17/15
to plots-spe...@googlegroups.com
greate Amir, cheers
As I wrote I am just playing around to explore the possibilities
I used your tool to export data from a file I had and the created CSV as input to plot on plotly with additional (dummy data).
The bottom left embedded plot
To unsubscribe from this group and all its topics, send an email to plots-spectrome...@googlegroups.com.
For more options, visit https://groups.google.com/d/optout.
--
Post to this group at plots-sp...@googlegroups.com
Public Lab mailing lists (http://publiclab.org/lists) are great for discussion, but to get attribution, open source your work, and make it easy for others to find and cite your contributions, please publish your work at http://publiclab.org
---
You received this message because you are subscribed to a topic in the Google Groups "plots-spectrometry" group.
To unsubscribe from this topic, visit https://groups.google.com/d/topic/plots-spectrometry/TZ43bV7wh3E/unsubscribe.
To unsubscribe from this group and all its topics, send an email to plots-spectrome...@googlegroups.com.
Amir Bernat
Jun 17, 2015, 4:32:10 AM6/17/15
to plots-spe...@googlegroups.com
I'm not sure I understood why you needed another program to generate the graph, note you can right click on it to export as image. Any way glad to hear I could help!
Amir
Amir Bernat
Jun 17, 2015, 4:32:11 AM6/17/15
to plots-spe...@googlegroups.com
Roni Segoly
Jun 17, 2015, 4:42:35 AM6/17/15
to plots-spe...@googlegroups.com
Amir
Eventually I will need to do it offline and give the parsing tool the file to parse as command line parameter so no need to human interversion
On Wed, Jun 17, 2015 at 11:32 AM, Amir Bernat <ami...@gmail.com> wrote:
I'm not sure I understood why you needed another program to generate the graph, note you can right click on it to export as image. Any way glad to hear I could help!
Amir
--
Jeffrey Warren
Jun 17, 2015, 11:12:27 AM6/17/15
to plots-spe...@googlegroups.com
Apologies, I was traveling. There is a code snippet linked to at the bottom of the page I linked to: https://gist.github.com/jywarren/4945996
Once you run that (how often do you plan to do that?) you can access them at this feed: http://spectralworkbench.org/spectra/feed/rsegoly
Or, if you tag them all with a unique tag, at the URL: http://spectralworkbench.org/tags/uniquetag.json
For example: http://spectralworkbench.org/tags/cfl.json
Jeff
You received this message because you are subscribed to the Google Groups "plots-spectrometry" group.
To unsubscribe from this group and stop receiving emails from it, send an email to plots-spectrome...@googlegroups.com.
Roni Segoly
Jun 17, 2015, 11:48:57 AM6/17/15
to plots-spe...@googlegroups.com
Jeffery
that's a macro?
Can you walk me through? Where do I put the code?
Jeffrey Warren
Jun 17, 2015, 12:01:21 PM6/17/15
to plots-spe...@googlegroups.com
That's right - you can paste it into a new macro at http://spectralworkbench.org/macros
Roni Segoly
Jun 17, 2015, 12:41:14 PM6/17/15
to plots-spe...@googlegroups.com
Sorry for being layman
I pasted the macro and chose it as capture
I started capturing (using my laptop as is)
Does it mean files will be saved automatically? Where?
Jeffrey Warren
Jun 17, 2015, 12:49:26 PM6/17/15
to plots-spe...@googlegroups.com
yes, if you check http://spectralworkbench.org/profile/rsegoly they should begin to show up there. But how often and for how long will you be saving? We'd like to be sure it doesn't overload the server.
Your JavaScript console should display any errors if you see some; the macro hasn't been used in a while so we should double check that it still works.
Roni Segoly
Jun 17, 2015, 12:54:19 PM6/17/15
to plots-spe...@googlegroups.com
I will not overload the server, just testing now, then we will discuss how to handle, offline or on site
Currently I capture and let's see if files appear there
Jeffrey Warren
Jun 17, 2015, 12:59:16 PM6/17/15
to plots-spe...@googlegroups.com
Great - paste in a link to your macro and I can help troubleshoot if it doesn't work.
Roni Segoly
Jun 17, 2015, 1:00:35 PM6/17/15
to plots-spe...@googlegroups.com
Do I need to change something in the macro?
Jeffrey Warren
Jun 17, 2015, 1:10:52 PM6/17/15
to plots-spe...@googlegroups.com
Ah, the example is set to hourly. So I think you should set it to every 10 seconds for testing.
To run it, go to the capture interface and find the macro in the macros menu.
Roni Segoly
Jun 17, 2015, 1:17:29 PM6/17/15
to plots-spe...@googlegroups.com
it is 10 seconds now but can you look?
Jeffrey Warren
Jun 19, 2015, 1:43:16 PM6/19/15
to plots-spe...@googlegroups.com
Sorry, I'm offline at the moment, and haven't had a chance to look. Your macro doesn't seem to exist... i don't see it listed at http://spectralworkbench.org/macros.
But when I paste in my macro and change the interval to 1 second, it does work: http://spectralworkbench.org/profile/warren
Roni Segoly
Jun 20, 2015, 9:15:20 AM6/20/15
to plots-spe...@googlegroups.com
Once you have time and are online let's try again
Roni Segoly
Jun 20, 2015, 9:33:56 AM6/20/15
to plots-spe...@googlegroups.com
Jeffery
What I do not understand is how to include a macro in capture
I cated one and defined it as capture
I started capture and clicked the script button and I get basic script.
I click on it and I get the list of macros including mine
But now what?
Reply all
Reply to author
Forward
0 new messages