Radar CHART D3 component
22 views
Skip to first unread message

Eviling Fajardo
May 3, 2017, 8:17:38 AM5/3/17
to Pentaho Community
I'm using the d3 component radar chart in pentaho but i can't see the graph.
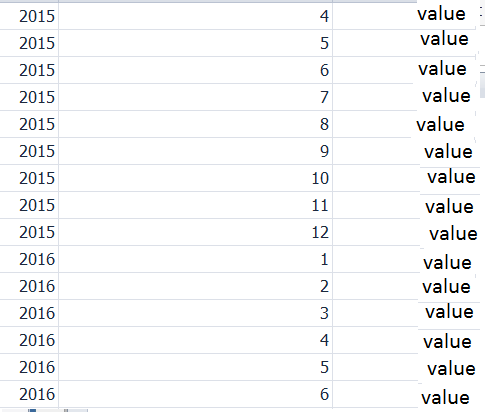
The datasource component is SQL, the data is structure in 3 columns: year(variable), month(axis) and value.
The component panel has the datasource and the HTML object
This is D3 chart I'm using https://www.visualcinnamon.com/2015/10/different-look-d3-radar-chart.html
I don't know if I have to do something else
My data is like this (I substituted the numbers in the picture):

Pedro Alves
May 3, 2017, 9:54:51 AM5/3/17
to pentaho-...@googlegroups.com
d3's visualizations are very very specific; you need to debug the code and make sure you feed the correct format for the radar chart you're interested in building
-pedro
--
You received this message because you are subscribed to the Google Groups "Pentaho Community" group.
To unsubscribe from this group and stop receiving emails from it, send an email to pentaho-community+unsubscribe@googlegroups.com.
To post to this group, send email to pentaho-community@googlegroups.com.
To view this discussion on the web visit https://groups.google.com/d/msgid/pentaho-community/362d1240-b7f9-4bc1-a4bb-a4449f1e2fd0%40googlegroups.com.
For more options, visit https://groups.google.com/d/optout.
Reply all
Reply to author
Forward
0 new messages