Read path in TSDB and optimization for queries
71 views
Skip to first unread message

Avind
Mar 30, 2018, 12:13:52 AM3/30/18
to OpenTSDB
This is our setup
- Cloud based Paas Hbase (3 region nodes) .. 50 regions each.
- TSDB table has been pre-split (150 splits across all available regions) and we have uniform writes & no hot spots (enabled random metrics creation, no salting)
- TSD's running on independent VM's behind a LB (only read through this path)
- 2 core 8 GB RAM machines with 4~5 GB allocation to TSD JVM
We have been trying to measure out read performance and this is a summary of our observations ..
- all testing was done directly on the tsd's with scripts running curl
- all metrics are unique with no significant tag carnality (<2)
- data points are at 1 min frequency for all metrics.
- data has been loaded for 2 years for all metrics.
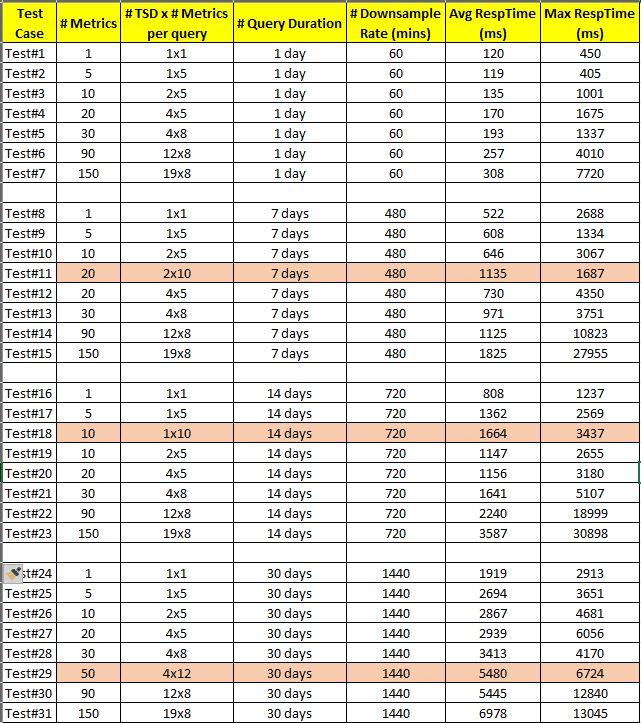
Timing observations are also attached in case the table below breaks on posting ..
| Test Case | # Metrics | # TSD x # Metrics per query | # Query Duration | # Downsample Rate (mins) | Avg RespTime (ms) | Max RespTime (ms) |
| Test#1 | 1 | 1x1 | 1 day | 60 | 120 | 450 |
| Test#2 | 5 | 1x5 | 1 day | 60 | 119 | 405 |
| Test#3 | 10 | 2x5 | 1 day | 60 | 135 | 1001 |
| Test#4 | 20 | 4x5 | 1 day | 60 | 170 | 1675 |
| Test#5 | 30 | 4x8 | 1 day | 60 | 193 | 1337 |
| Test#6 | 90 | 12x8 | 1 day | 60 | 257 | 4010 |
| Test#7 | 150 | 19x8 | 1 day | 60 | 308 | 7720 |
| Test#8 | 1 | 1x1 | 7 days | 480 | 522 | 2688 |
| Test#9 | 5 | 1x5 | 7 days | 480 | 608 | 1334 |
| Test#10 | 10 | 2x5 | 7 days | 480 | 646 | 3067 |
| Test#11 | 20 | 2x10 | 7 days | 480 | 1135 | 1687 |
| Test#12 | 20 | 4x5 | 7 days | 480 | 730 | 4350 |
| Test#13 | 30 | 4x8 | 7 days | 480 | 971 | 3751 |
| Test#14 | 90 | 12x8 | 7 days | 480 | 1125 | 10823 |
| Test#15 | 150 | 19x8 | 7 days | 480 | 1825 | 27955 |
| Test#16 | 1 | 1x1 | 14 days | 720 | 808 | 1237 |
| Test#17 | 5 | 1x5 | 14 days | 720 | 1362 | 2569 |
| Test#18 | 10 | 1x10 | 14 days | 720 | 1664 | 3437 |
| Test#19 | 10 | 2x5 | 14 days | 720 | 1147 | 2655 |
| Test#20 | 20 | 4x5 | 14 days | 720 | 1156 | 3180 |
| Test#21 | 30 | 4x8 | 14 days | 720 | 1641 | 5107 |
| Test#22 | 90 | 12x8 | 14 days | 720 | 2240 | 18999 |
| Test#23 | 150 | 19x8 | 14 days | 720 | 3587 | 30898 |
| Test#24 | 1 | 1x1 | 30 days | 1440 | 1919 | 2913 |
| Test#25 | 5 | 1x5 | 30 days | 1440 | 2694 | 3651 |
| Test#26 | 10 | 2x5 | 30 days | 1440 | 2867 | 4681 |
| Test#27 | 20 | 4x5 | 30 days | 1440 | 2939 | 6056 |
| Test#28 | 30 | 4x8 | 30 days | 1440 | 3413 | 4170 |
| Test#29 | 50 | 4x12 | 30 days | 1440 | 5480 | 6724 |
| Test#30 | 90 | 12x8 | 30 days | 1440 | 5445 | 12840 |
| Test#31 | 150 | 19x8 | 30 days | 1440 | 6978 | 13045 |
Questions
- Is this a reasonable performance with the setup we have .. can we do any better?
- Also wanted to know what is the read pattern for a query with multiple metrics..(did not get any good doc explaining the way the query is actually executed across TSD and Hbase)
- i.e. is there any parallelism in read from hbase.
- Note .. The max response time is usually the 1st read ..
- All averages are over a 100 cycle run for each query ..

ManOLamancha
May 22, 2018, 2:23:21 PM5/22/18
to OpenTSDB
On Thursday, March 29, 2018 at 9:13:52 PM UTC-7, Avind wrote:
Questions
- Is this a reasonable performance with the setup we have .. can we do any better?
Wow thanks for that detail! The timings do look about right. Some other things to check:
* See what the cache hit-rate is in HBase for the reads
* See if the UIDs have been cached for the queries in OpenTSDB. E.g. between each bench are you restarting the TSD VMs or letting them run? When restarting, there is a lot of latency introduced by the lazy initialization of HBase connections and the UID lookups.
* Enable query summaries to see where most of the time is spent.
- Also wanted to know what is the read pattern for a query with multiple metrics..(did not get any good doc explaining the way the query is actually executed across TSD and Hbase)
- i.e. is there any parallelism in read from hbase.
I need some good docs on this. There is a big bottleneck that we need to address in that for each region server, an asynchronous client is created that listens for responses from that client on a single thread. The TSD will parallelize queries on a per metric basis (and per salt if salting is enabled, in your case it likely isn't). So if you have 150 metrics, they'll be sent to the region server at the same time asynchronously. However the response will be processed essentially synchronously in that the region server will keep sending the responses to a single network queue that the AsyncHBase client processes and sends to the TSD one RPC response at a time. I'd like to add a dynamic client pool to AsyncHBase to help out with this. We'll also likely enable use of the native HBase client for queries as it uses multiple threads for reads.
- Note .. The max response time is usually the 1st read ..
That would indicate you're populating the block cache in HBase. Or if you're restarting the TSD it's the time to connect to HBase find the regions and start the query.
Reply all
Reply to author
Forward
0 new messages