[GSoC 2014 | OpenBEL Webtools] BEL Graphs Visualization
32 views
Skip to first unread message

Jonathan Nunes Boilesen
Aug 11, 2014, 12:24:57 PM8/11/14
to openbel...@googlegroups.com
Hi all!!
It's a pleasure to say that now it is possible to visualize .bel files as directed graphs in our project OpenBEL Webtools. =)
By now, we are using Cytoscape.js to create these visualizations, but if you have any plugin you would like to see working with our project, please, feel free to ask for it.
I'm writing a detailed "Setup Instructions" that will be available soon.
Our project was built under Ruby on Rails and we made use of the BEL gem.
Also, I'm actually coding a Adjacent Subgraph view, so users can visualize all connections each term have.
Please, feel free to ask for help and comment.
As soon as I update our project I e-mail you here ;)
Best regards,
Jonathan Nunes Boilesen

Anthony Bargnesi
Aug 11, 2014, 10:49:42 PM8/11/14
to openbel...@googlegroups.com
Jonathan,
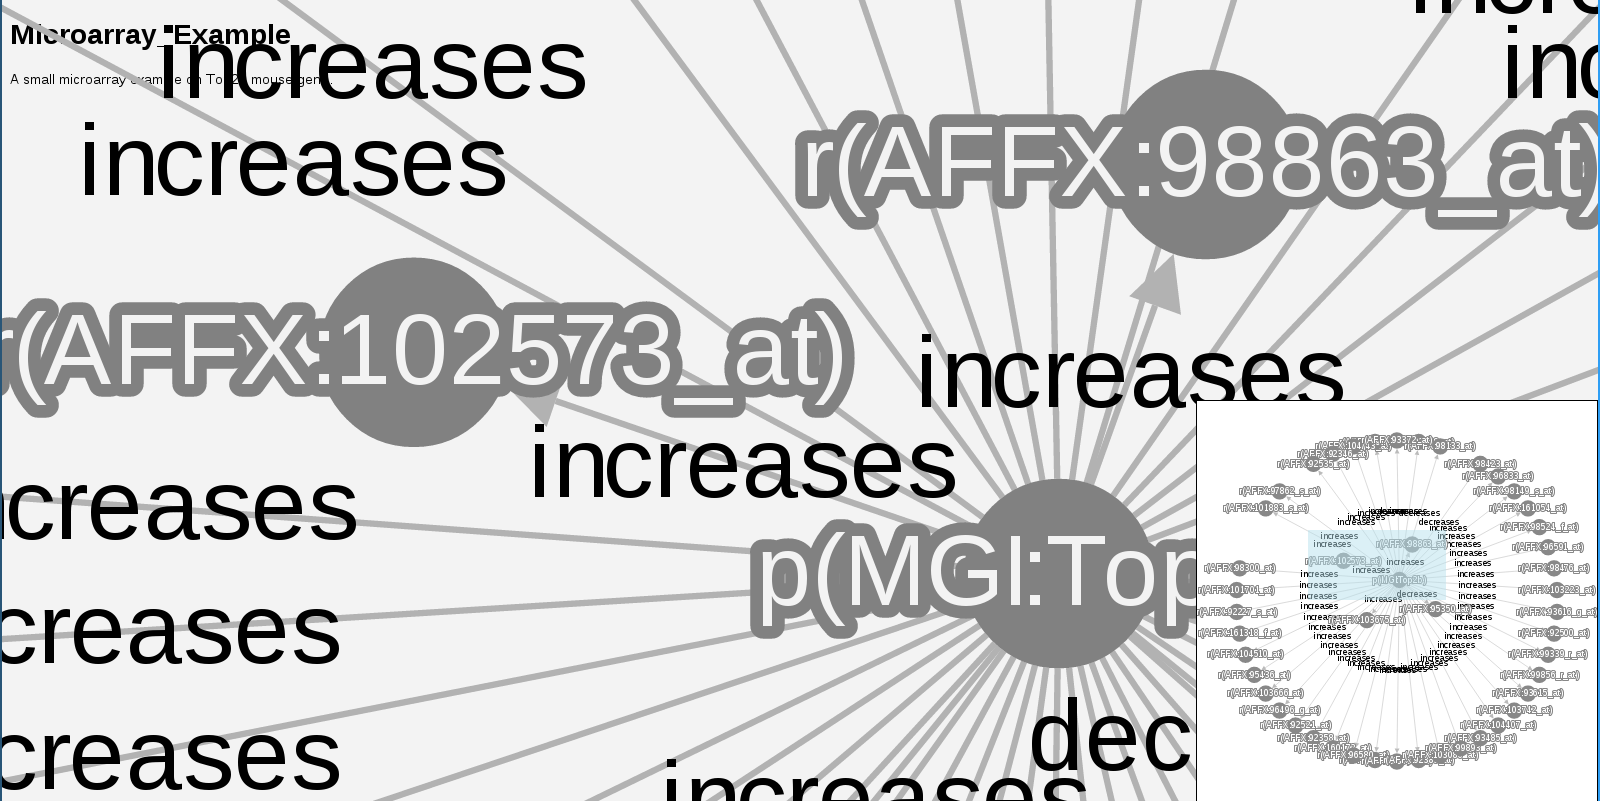
Great work! I was able to load the Small Corpus and Microarray BEL examples we have and figured I would attach screenshots here.
Thanks!
Anthony Bargnesi
Great work! I was able to load the Small Corpus and Microarray BEL examples we have and figured I would attach screenshots here.
Thanks!
Anthony Bargnesi
Reply all
Reply to author
Forward
0 new messages