Using DataViz technologies on ArchiMate models
140 views
Skip to first unread message

jean-baptis...@arismore.fr
Oct 18, 2016, 5:23:17 AM10/18/16
to ArchiMate
It seems we are more and more working on ArchiMate models with DataViz technologies. Michael Herman's last post provide a good example of what can be achieved.
I was wondering if we could not start sharing ideas about use cases of some kind of visualization.
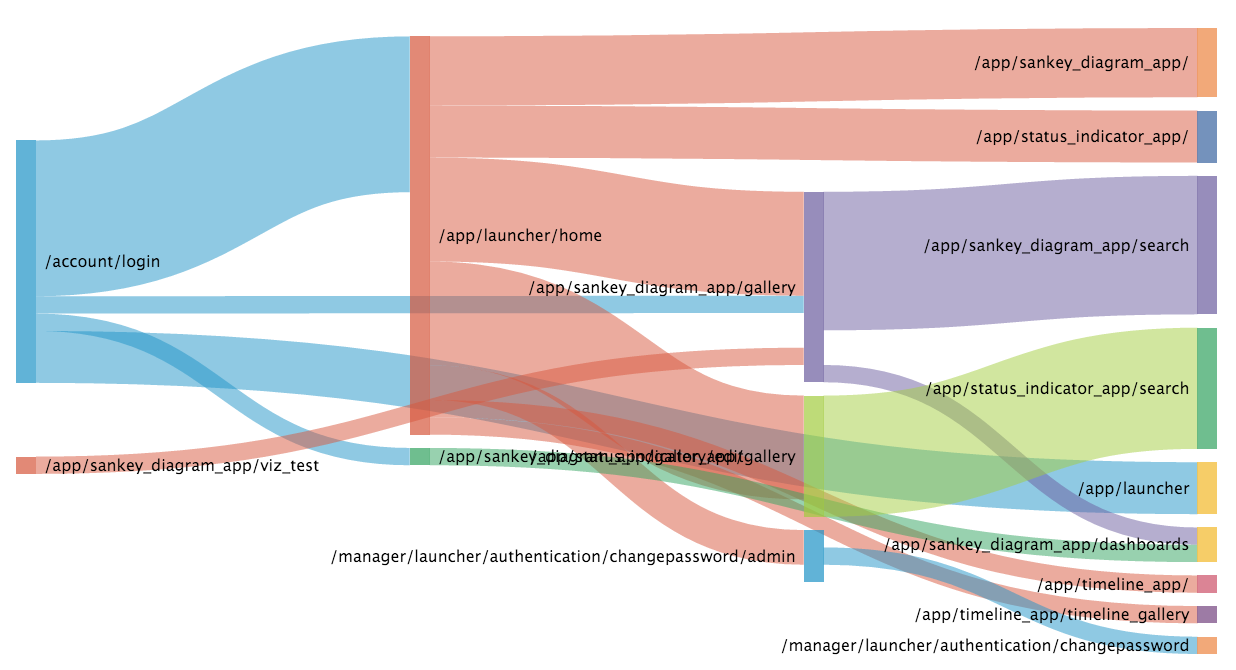
For example, I think Sankey Diagram (see example below) could be used to show dependancies between (service) layers, where each layer lists services exposed to upper one.
What would be your DataViz use-cases?
JB

caedw...@gmail.com
Oct 24, 2016, 10:28:53 PM10/24/16
to ArchiMate
Hello Jean- I have two very specific uses cases that I am very interested in.
1) The ability to perform impact analysis across a set of connected architectural elements (see the first attachment for an example of this use case). In addition to the mathematical impact analysis I am also looking to visualize the elements as a set of interconnected nodes and lines (i.e. network graph visualization - see the second attachment for an example)
2) There is a strong need to take a Business Motivation hierarchy (especially of Goals) and then create a network graph out of it (i.e. links and nodes) and then assign 'weights' to the nodes that represent the impact of the originating node to the end point node. This 'weight' reflects the contribution of completing the originating goal on the end-point goal. So for example if completing Goal A also contributes to providing 10% of the value towards the completion of Goal B, then the 'weight' on the link from A to B would be 1.1. One would then use statistical and fundamental analytics to 'calculate' the impact of any one goal on completion of any other selected goal. One could also use the same network to calculate the 'optimal' walk through the overall goal network.
caedw...@gmail.com
Oct 24, 2016, 10:44:28 PM10/24/16
to ArchiMate
I meant to post the following reference for attachment #2. Use this one and disregard the one in the previous post regarding the Syracom Architecture Tool Survey.
Reply all
Reply to author
Forward
0 new messages