node-red-dashboard 2.0 now available

3,548 views
Skip to first unread message

Nicholas O'Leary

unread,
Jul 25, 2016, 6:19:17 PM7/25/16
to Node-RED Mailing List, Node-RED UI
Hi,

I've just hit publish on node-red-dashboard. It is now live on npm.

This is the successor to the node-red-contrib-ui project started by Andrei Tatar which we've brought under the main node-red project to develop it further.

node-red-dashboard provides the same functionality as contrib-ui, but we've also taken this opportunity to make some breaking changes. This means it is not a 100% seamless upgrade between the two. If you have an existing dashboard with contrib-ui, you should upgrade with care.

Some quick notes on migrating:

1. backup your flow file so you can roll back to contrib-ui if needed. We've tested a set of basic migrations, but there may well be edge cases we didn't think of.

2. node-red-contrib-ui and node-red-dashboard provide the same set of node types. This means you cannot have both installed at the same time. Make sure you uninstall contrib-ui before installing dashboard.

3. When you first open a contrib-ui flow under dashboard, your nodes may have errors against them. This will be because they are missing a 'group' node. In the new dashboard sidebar (see below), you'll get a notification that not all nodes are in groups, with a button to try to auto-fix it... clicking that should create a default tab and the missing groups for you.

4. If you used the Template node to create a custom theme for the dashboard you'll soon discover we've changed the css classnames of all the elements to make them uniform and consistent.


The main new feature of this version is the addition of the dashboard sidebar in the editor. This gives you a tree view of your tabs/groups/widgets, within which you can drag items around to move/reorder them between tabs or groups. It is also where you now add custom links to the dashboard's menu, rather than add them as nodes in the workspace. We've removed the ability to set a different theme per tab - now you set a dashboard-wide theme via the sidebar and we provide a default dark and light theme. We will make it easier to create custom themes in the future - so you don't have to resort to a Template node injecting css.


The early feedback we've had from a few beta testers has been very positive - but as ever, we want to know what you think.


Nick

Brad Hopper

unread,
Jul 25, 2016, 6:25:38 PM7/25/16
to Node-RED
Nice! Will check it out right away!

Stephen Wallace

unread,
Jul 25, 2016, 8:05:18 PM7/25/16
to Node-RED
Node-Red-Dashboard is an outstanding addition to the package. I added it a couple of weeks ago to my setup and it has completely replaced my previous Freeboard dashboard.

The "Dashboard Pane" is a real improvement.

I updated to the most recent version by uninstalling and then reinstalling node-red-dashboard. After reassigning the groups, everything seemed to work fine. The only thing that isn't working for me is that only the "light" theme is used, even if the "dark" theme is selected. Is this a problem for other people? I am using Node-Red 0.14.3

Also, is there a mechanism password protect dashboard pages separately so login to the node-red pages is not required?

Thanks, and great work!

Nicholas O'Leary

unread,
Jul 26, 2016, 2:18:41 AM7/26/16
to Node-RED

Forgot to say, you must be running Node-RED 0.14 to use node-red-dashboard - now would be a good time to upgrade to 0.14.5 we released at the weekend. It should be on the Pi any day now.

Nick


--
http://nodered.org
 
Join us on Slack to continue the conversation: http://nodered.org/slack
---
You received this message because you are subscribed to the Google Groups "Node-RED" group.
To unsubscribe from this group and stop receiving emails from it, send an email to node-red+u...@googlegroups.com.
To post to this group, send email to node...@googlegroups.com.
Visit this group at https://groups.google.com/group/node-red.
For more options, visit https://groups.google.com/d/optout.

Steven Daglish

unread,
Jul 26, 2016, 4:03:03 AM7/26/16
to Node-RED, node-red-...@googlegroups.com
Thanks for the great work guys.

Just updated from the pre-release version and so far everything looks great.

Can't see any obvious issues but will let you know if I find anything.

I need to play around with the dashboard editor a bit more as that looks interesting.

Steven

Walter Kraembring

unread,
Jul 26, 2016, 7:43:55 AM7/26/16
to Node-RED, node-red-...@googlegroups.com
Thanks!

Upgrade worked fine (uninstalled ui and then installed dashboard), no problems but I have a very simple dashboard

The only thing that isn't working for me is that only the "light" theme is used, even if the "dark" theme is selected

For me it was different: it all started with light. Once I selected to dark it certainly switched to dark but the reverse to light is not possible anymore

Using node-red 0.14.3

Best regards, Walter 

Bruce Richardson

unread,
Jul 26, 2016, 9:27:17 AM7/26/16
to Node-RED, node-red-...@googlegroups.com
This is great. You've laid some great foundations here. 

Some feedback:
I'm also not getting a difference when I change to dark theme. 

Something you might want to consider for a future release. Would it be possible to set the min and max values for a gauge from a variable ? 
One thing I would like to use this for is a running total of jobs completed, but the total number of jobs keeps changing (upwards - no surprise there). 

thanks again

Bruce


JR01

unread,
Jul 26, 2016, 9:52:22 AM7/26/16
to Node-RED UI, node...@googlegroups.com
Yaaahhhhiiii !

Thanks Nick, also upgraded to pre-release 2 days ago. Smooth and Good !

Walter Kraembring

unread,
Jul 26, 2016, 12:50:59 PM7/26/16
to Node-RED, node-red-...@googlegroups.com
I'm also not getting a difference when I change to dark theme. 

After a reboot, I have now also the same behavior 

Paul Reed

unread,
Jul 26, 2016, 4:45:48 PM7/26/16
to Node-RED UI, node...@googlegroups.com
All good here, just had to sort out the groups and labels and the transition went smoothly, and without issue. The dark scheme also a nice addition.

Paul


Dean Cording

unread,
Jul 26, 2016, 8:34:27 PM7/26/16
to Node-RED, node-red-...@googlegroups.com
Looks good.  Could all the nodes have a configuration setting that allows them to specify which msg property they act on instead of just msg.payload.  For example, I have a weather system that outputs the current weather conditions, temp/humidity/wind, as a single msg - graphing each property requires a degree of msg wrangling that shouldn't really be necessary.

Dean

Steven Keller

unread,
Jul 27, 2016, 1:10:04 AM7/27/16
to Node-RED, node-red-...@googlegroups.com
This is awesome!  Great work!

Is there anyway to get a vertical bar graph cart?  Ideally it would allow an array of values to be sent to update multiple bars on the graph?

At very least can the Gage be modified as a vertical graph?

Thanks so much!


Dave C-J

unread,
Jul 27, 2016, 4:42:33 AM7/27/16
to node...@googlegroups.com

Bruce
What would the gauge show of the total keeps increasing ? Could it not show % complete ? (And do the maths in a function beforehand). And then have the total as a text box underneath ?

Peter Scargill

unread,
Jul 27, 2016, 4:26:34 PM7/27/16
to Node-RED UI, node...@googlegroups.com
All looking good to me - this is what I had hoped UI would become - if I may, most of it is trivial to use - for some (including me) that TEMPLATE isn't - all good until you try to do something different with it...  A suggestion - could be you guys - could be some other place - a good selection of examples with different I/O including variables would go a long way to realising the potential of that node.

Dave C-J

unread,
Jul 27, 2016, 5:26:48 PM7/27/16
to node...@googlegroups.com, L...@gmail.com

Well, ideally we wouldn't need the template node, but we know a lot of contrib-ui users used it to do stuff that the basic nodes couldn't, so we couldn't just remove it... Hopefully the base widgets should improve to handle more of the use cases currently caught by it. And you all are already sending in suggestions.

Happy for anyone to help improve docs, examples, etc, either directly or via blog posts, snipers, flows site ...

Federico Boesche

unread,
Jul 27, 2016, 6:27:53 PM7/27/16
to Node-RED, node-red-...@googlegroups.com
Great job! Thank you very much.

I upgraded from node-network-contrib-ui to the dashboard and everything worked perfect.
Is there any plan to make dashboard multiuser?
Message has been deleted

Dave C-J

unread,
Jul 29, 2016, 11:36:51 AM7/29/16
to node...@googlegroups.com

We based the project on the dev branch of contrib-ui, as it had some of Andrei's thinking about re-sizing, and other ideas. It had removed radio buttons so we went with it.

Brad Hopper

unread,
Jul 29, 2016, 4:59:40 PM7/29/16
to Node-RED UI, node...@googlegroups.com
Sadly for me this just isn't working well.

I have two node-red rpi's - a rev2 and a Zero. Been working more with the Zero since that's my intended deployment form.

However, I originally deployed (uninstall contrib-ui then install -dashboard) on the rpi2, and as soon as that finished, I rebooted the machine and it wouldn't come back up. I couldn't get into it via SSH, just locked out. Since that deploy it's just been a doorstop. I don't think it's bricked but for some reason can't get back into ethernet or wireless to communicate. Haven't lugged out the hdmi cables to plug into tv etc since I don't have a wired keyboard...

Anyway also did a deploy to the Zero, which had not yet been deployed the old contrib-ui. Tried multiple times to npm i node-red-dashboard then reboot but the nodes just wouldn't show up. Finally, I think I had to update to 14.5 first then do sudo npm i -g to get it to show up. Then the machine is very flaky to connect to the web console. It just seems to hang over and over at different points during painting the canvas area. I think there's some relationship with the wireless because the board previously connected very well from my bench and I could do whatever tasks, but with the latest upgrade and dashboard deploy the connection is very flaky. If I bring the whole thing closer to the router it will connect but it seems to be running slower than before despite iwconfig showing very high quality and 85% signal.

During brief times of being up, I tried to place a chart node, which I was able to configure correctly and deploy, but immediately after deploy the system would lose connectivity. After reboot I get back to the canvas but there's no dashboard node in the flow any more. Same with a slider widget. Just seems to be more unstable now and haven't yet seen a successful chart or ui element show up, as I can't get the /ui to paint without a lost connection.

Just sort of stuck now. Is there any way to troubleshoot? Any logs to look into? node-red-log doesn't show anything (I previously, on the rpi2, changed the logging level but never saw a difference in detail of the logs). TOP seems to show the machine isn't working very hard.

Phil Grant

unread,
Jul 30, 2016, 6:51:33 PM7/30/16
to Node-RED UI, node...@googlegroups.com
Hi,
Just removed UI and installed dashboard but no nodes appear on the left side and all ui nodes are dotted red.  I get the following when I start node red
Welcome to Node-RED
===================
30 Jul 23:47:43 - [info] Node-RED version: v0.13.3
30 Jul 23:47:43 - [info] Node.js  version: v0.10.29
30 Jul 23:47:43 - [info] Linux 4.1.18-v7+ arm LE
30 Jul 23:47:43 - [info] Loading palette nodes
pi
: TTY=unknown ; PWD=/ ; USER=root ; COMMAND=/usr/bin/python -u /usr/lib/node_modules/node-red/nodes/core/hardware/nrgpio.py info
pam_unix
(sudo:session): session opened for user root by (uid=0)
pam_unix
(sudo:session): session closed for user root
30 Jul 23:47:49 - [info] Dashboard up and running
30 Jul 23:47:55 - [warn] ------------------------------------------
30 Jul 23:47:55 - [warn] Failed to register 1 node type
30 Jul 23:47:55 - [warn] Run with -v for details
30 Jul 23:47:55 - [warn] ------------------------------------------
30 Jul 23:47:55 - [info] Settings file  : /home/pi/.node-red/settings.js
30 Jul 23:47:55 - [info] User directory : /home/pi/.node-red
30 Jul 23:47:55 - [info] Flows file : /home/pi/.node-red/flows_raspberrypi.json
30 Jul 23:47:55 - [info] Server now running at http://127.0.0.1:1880/
30 Jul 23:47:55 - [info] Waiting for missing types to be registered:
30 Jul 23:47:55 - [info]  - ui_tab
30 Jul 23:47:55 - [info]  - ui_chart
30 Jul 23:47:55 - [info]  - ui_text
30 Jul 23:47:55 - [info]  - ui_button
30 Jul 23:47:55 - [info]  - ui_link
30 Jul 23:47:55 - [info]  - ui_switch
30 Jul 23:47:55 - [info]  - ui_gauge

Any suggestions?

Thanks.

Paul Reed

unread,
Jul 30, 2016, 6:57:30 PM7/30/16
to Node-RED, node-red-...@googlegroups.com
Isn't the requisite for node-red-dashboard to be running v0.14.x?

Paul

Phil Grant

unread,
Jul 30, 2016, 7:14:35 PM7/30/16
to Node-RED UI, node...@googlegroups.com
Cheers,
I'll update Node Red then.

Phil Grant

unread,
Jul 31, 2016, 5:55:25 PM7/31/16
to Node-RED UI, node...@googlegroups.com
Worked after update thanks but the test items on a dropdown don't appear, the options are there and they populate a text box OK but they are not visible in the dropdown list?


On Monday, 25 July 2016 23:19:15 UTC+1, Nick O'Leary wrote:

Mike Bell

unread,
Aug 1, 2016, 3:11:19 AM8/1/16
to Node-RED, node-red-...@googlegroups.com

Nick,

Node-red-dashboard has been working brilliantly for me, and the dark theme is nicely readable and elegant. I really appreciate the effort that went into this, but I would love to see some options for customizing a few of the nodes I use most:

Gauge (ui_gauge) - The standard (gauge) and donut forms of this node use a color range from green for low values to red for high ones. I would like to be able to reverse this for situations where high is "good" and low is "bad." 

Text output (ui_text) - Control over font style, size, and color would help in harmonizing text displays with other visual elements in the dashboard.

Notification (ui_toast) - This node would be much more useful if one could change the location,  duration, and appearance of the notification. It might also be nice to have the option of keeping the alert on screen until dismissed by the user.

Presently, these node properties can't be configured in the editor, but I assume that at least some of these changes could be hard-coded by someone familiar with the modules (and more skilled in javascript/angular/html than I am). Perhaps, at the risk of encouraging a flock of non-standard variants, the development team could provide some notes on where to find the parameters or bits of codes that would have to be changed.

Thanks again for the excellent work.

Mike

Dave C-J

unread,
Aug 1, 2016, 4:01:56 AM8/1/16
to node...@googlegroups.com
Hi Mike,
thanks - yes gauge colours have been mentioned already. 

Not sure what you mean re text - It should currently be "harmonised" with the other widgets. Anything radically custom can be done with the template node - but maybe we're missing something ?

Toast - yes more options (like position and timing) are possible.

n. Di

unread,
Aug 1, 2016, 5:06:01 AM8/1/16
to Node-RED UI, node...@googlegroups.com
Guys is it somehow possible to use this wihin IBM Bluemix?

I tryed using the node-red-contrib-ui to visualize my JSON string with sensor data obtain from an connected ESP8266.
But seems like there is kind of a memory bug, the RAM workload of the Browers keeps increasing constantly (No matter which browers, I tryed Firefox, Chrome, IE). At some point it crashed because of too much memory consumption.

I was hoping for this dashboard node, but unfortunatly it does not work for me, neither locally nor in Bluemix.

I ge following error when i try to open the UI:

Dave C-J

unread,
Aug 1, 2016, 5:56:44 AM8/1/16
to node...@googlegroups.com
contrib-ui is not dashboard...   (ok it was... but now dashboard is out you should use that instead :-) )

On quick way to get it installed it to start from my bluemix-starter project here https://github.com/dceejay/node-red-bluemix-starter

you can either clone the project and modify the package.json and web links as described - or just use the button as-is to create a basic project with dashboard already installed.

Nicholas O'Leary

unread,
Aug 1, 2016, 6:02:04 AM8/1/16
to Node-RED Mailing List
But if you want to add it to your existing instance, rather than have to recreate from scratch, you only need to add 'node-red-dashboard' to your package.json file (you can copy that from the package.json in the repo Dave has linked to).

Just make sure you don't have both contrib-ui and dashboard installed and that you are using Node-RED 0.14 or later.

Nick

--
http://nodered.org
 
Join us on Slack to continue the conversation: http://nodered.org/slack
---
You received this message because you are subscribed to the Google Groups "Node-RED" group.
To unsubscribe from this group and stop receiving emails from it, send an email to node-red+u...@googlegroups.com.
To post to this group, send email to node...@googlegroups.com.
Visit this group at https://groups.google.com/group/node-red.

n. Di

unread,
Aug 1, 2016, 6:13:40 AM8/1/16
to Node-RED UI, node...@googlegroups.com
Thank you this is a great help to visualize my JSON sensor data!

I have some suggestions too:

1.) Could you add a field to enter the unit for y-axis on the graph chart
2.) Maybe it is possible to select the position of the charts?

Dave C-J

unread,
Aug 1, 2016, 7:29:39 AM8/1/16
to node...@googlegroups.com
Thanks for the feedback, What do mean by select the position ? they will autofit into the size you specify.

Matt

unread,
Aug 1, 2016, 2:07:01 PM8/1/16
to Node-RED UI, node...@googlegroups.com
This is great! My laziness towards teaching myself html/css has finally paid off, I was able to throw together a site for my home monitoring stuff within a few minutes.

I don't find any of the built in gauge variants very useful, they're a bit "cutesy" for me (e.g. the animated level). It would be nice to have a plain bar graph style.
My only other request would be to be able to set the fundamental scale of the grid. Possibly an addition when more theming options are more fleshed out?

I did run into a couple of odd scenarios where the hierarchy seemed to get messed up (groups assigned to one tab but appearing in another) but I will have to try to recreate the issue in a systematic way.

Matt

Dave C-J

unread,
Aug 1, 2016, 2:37:25 PM8/1/16
to node...@googlegroups.com
too cutesy ? - all well can't please everyone - guess you'll have to polish up those html and css skills after all :-)

Yes - bar chart has been mentioned and is on the ideas list.

Fundamental scale ? you mean what a size unit of "1" equates to ? (currently 50px).
If so then possibly - though there are quite a few other hardcoded wrinkles that need to be investigated and sorted around sizing that may or may not make this easy to do.

Yes please - if can find and replicate any broken scenarios please let us know.

Thanks

Matt

unread,
Aug 1, 2016, 3:16:53 PM8/1/16
to node...@googlegroups.com
Haha, I didn't mean to sound disparaging, they all look very nice :)
It's probably a holdover from my work on industrial HMIs where things tend to be more stark and utilitarian. I find that effects like the colour gradient on the gauge and the animated wave on the level make them less general purpose than they could be.

And yeah by fundamental scale I meant the size of a 1x1 item. If that's baked in then I'll just have to hone up on the html like you suggest :)

--
http://nodered.org
 
Join us on Slack to continue the conversation: http://nodered.org/slack
---
You received this message because you are subscribed to the Google Groups "Node-RED" group.
To unsubscribe from this group and stop receiving emails from it, send an email to node-red+u...@googlegroups.com.
To post to this group, send email to node...@googlegroups.com.
Visit this group at https://groups.google.com/group/node-red.

Dave C-J

unread,
Aug 1, 2016, 3:29:14 PM8/1/16
to node...@googlegroups.com
we are currently looking at allowing the colour gradient to be customised - so you can a bit less cute.
And bar chart should address the other.

Yes currently baked in - or as we prefer... opinionated.

n. Di

unread,
Aug 2, 2016, 6:41:55 PM8/2/16
to Node-RED UI, node...@googlegroups.com
May I ask which size of the dashboard you have used to fit this that perfectly on the mobile screen ?
I have troubles finding the right size for the screen. And how did you exactly manage to get two sensors signals into on graph? On the graph description it says to use a different msg.topic, but I got my JSON string from Bluemix and the topic is pre defined there.

Am Dienstag, 26. Juli 2016 15:52:20 UTC+2 schrieb JR01:
Yaaahhhhiiii !

Thanks Nick, also upgraded to pre-release 2 days ago. Smooth and Good !

JR01

unread,
Aug 3, 2016, 2:56:40 AM8/3/16
to Node-RED UI, node...@googlegroups.com
The default size, then the graphs I did 3x3, 2 graphs on - use 2 flows, from in my case MQTT queues, where I use a function to set the topic name, one 'Outside Temp'; other one 'Inside Temp', then, connect both the flows to the Chart node.

n. Di

unread,
Aug 3, 2016, 4:25:22 AM8/3/16
to Node-RED UI, node...@googlegroups.com
Thank you. How does your function node for setting the topic names look like? I tryed this also but somehow i cannot manage to display them both.

Paul Reed

unread,
Aug 3, 2016, 4:32:54 AM8/3/16
to Node-RED, node-red-...@googlegroups.com
n .Di
Try the attached example.

Paul

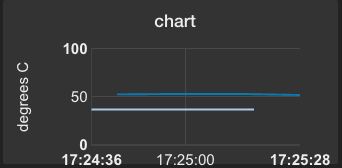
[{"id":"14533ec9.ef3501","type":"function","z":"6844b02f.2f6e5","name":"Create 2 values","func":"ValueToLine1 = Math.round(Math.random()*10*100)/100;\nValueToLine2 = Math.round(Math.random()*10*100)/100;\n\nline1 = { topic: 'line1', payload: ValueToLine1 };\nline2 = { topic: 'line2', payload: ValueToLine2 };\n  \nreturn [line1, line2];","outputs":"2","noerr":0,"x":302.8571319580078,"y":984.7143335342407,"wires":[["c67830d2.27318"],["c67830d2.27318"]]},{"id":"45bddc94.58aa04","type":"inject","z":"6844b02f.2f6e5","name":"","topic":"","payload":"","payloadType":"date","repeat":"5","crontab":"","once":false,"x":111.85713195800781,"y":984.7143335342407,"wires":[["14533ec9.ef3501"]]},{"id":"c67830d2.27318","type":"ui_chart","z":"6844b02f.2f6e5","group":"25555de.b146da2","order":2,"width":"","height":"","label":"","name":"multi chart","interpolate":"cardinal","nodata":"No Data","ymin":"","ymax":"","removeOlder":1,"removeOlderUnit":"60","x":522.8571319580078,"y":984.7143335342407,"wires":[[],[]]},{"id":"25555de.b146da2","type":"ui_group","z":"","name":"Examples","tab":"6548f53a.48923c","order":1,"disp":true,"width":"6"},{"id":"6548f53a.48923c","type":"ui_tab","z":"6844b02f.2f6e5","name":"Test","icon":"school","order":2}]

n. Di

unread,
Aug 3, 2016, 4:54:54 AM8/3/16
to Node-RED UI, node...@googlegroups.com
Ahh thank you very much, now it is working for me :)

Dave C-J

unread,
Aug 3, 2016, 3:26:13 PM8/3/16
to node...@googlegroups.com
All,
I have pushed a few small updates to dashboard to the master branch on github. They include
    Toast/Notification node can now configure position and duration. - The positions are limited to top left, top right, bottom left and bottom right, as these are the option available to the underlying angular-material control. 
    Gauge - can now specify colours for the wipe - The area is split into 3 sectors - and the colours are blended between them.
    

Paul Reed

unread,
Aug 3, 2016, 7:01:22 PM8/3/16
to Node-RED, node-red-...@googlegroups.com
n .Di
You've probably already noticed, that unfortunately there's no Legend at the moment, so it's hard to discriminate between the two chart topics...

Paul 

Dave C-J

unread,
Aug 4, 2016, 2:42:29 AM8/4/16
to node...@googlegroups.com

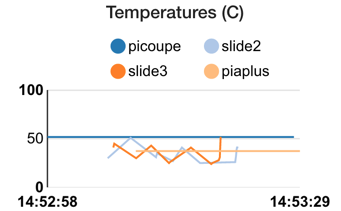
Paul, until you mouse over one of the points. The floating tip reveals the topic/data.

Paul Reed

unread,
Aug 4, 2016, 4:41:20 AM8/4/16
to Node-RED
Aaah yes!

Tony Neal

unread,
Aug 4, 2016, 9:46:41 AM8/4/16
to Node-RED, node-red-...@googlegroups.com
re Bluemix

I used node-red-contrib-admin in my package.json and then installed node-red-dashboard through the front end.... working well.

Great stuff Dave and Nick!

n. Di

unread,
Aug 4, 2016, 10:04:57 AM8/4/16
to Node-RED UI, node...@googlegroups.com
Yes true. I just wanted to try it out, hoping for a legend and possibility to add units to the y-axis in future.

Dave C-J

unread,
Aug 4, 2016, 12:29:05 PM8/4/16
to node...@googlegroups.com
(IMHO) on small screens the legend takes up a disproportionate amount of real-estate, so having it available via mouse-over works well.
Likewise the left units label standsoff the Y axis by a good way - eg
Inline images 1
which again I think makes it all get cluttered and less readable.

Paul Reed

unread,
Aug 4, 2016, 4:27:03 PM8/4/16
to Node-RED
I tend to agree, but I'm sure many users would like to have the option...
If the chart line colours could be user selected, it would be easy to add a template node containing the legend, ie;

<div layout="row" layout-align="space-around start">
    <p>
        <b>Power - </b> 
        <ng-md-icon icon="stop" ng-style="{fill:'#cccccc'}" size="24"></ng-md-icon>
    </p>
    <p>
        <b>Solar - </b> 
        <ng-md-icon icon="stop" ng-style="{fill:'blue'}" size="24"></ng-md-icon>
    </p>
</div>


bluem...@gmail.com

unread,
Aug 5, 2016, 5:55:37 AM8/5/16
to Node-RED
How can I add that label for Y-axis? In the chart-node config, the label field just gives me a label on top of the graph (like in your example : chart).
Thank you.

Dave C-J

unread,
Aug 5, 2016, 9:55:46 AM8/5/16
to node...@googlegroups.com
Hi you can't (easily) - that was just me trying it out in dev mode to see how it looked.

Paul - and this is how the legend looks - I'm not a fan...
Inline images 1

Paul Reed

unread,
Aug 5, 2016, 5:48:39 PM8/5/16
to Node-RED
As per my last...
I do agree with you, but if the chart line colours could be user defined, a legend could easily be added via a template node, for users who would prefer a legend.

Paul


Dave C-J

unread,
Aug 6, 2016, 1:35:48 PM8/6/16
to node...@googlegroups.com
All

I have pushed some changes to master branch on git
Optional legend on line chart
Inline images 2
Inline images 3

Bar Chart mode 

Inline images 1

Tweaked theme to make widgets appear seamless.
Inline images 4

Paul Reed

unread,
Aug 6, 2016, 3:11:49 PM8/6/16
to Node-RED
Nice additions Dave!

Dave C-J

unread,
Aug 6, 2016, 3:30:28 PM8/6/16
to node...@googlegroups.com
we try to please
Message has been deleted

Steven Keller

unread,
Aug 6, 2016, 4:24:21 PM8/6/16
to Node-RED
Awesome!!!!

Brad Hopper

unread,
Aug 7, 2016, 7:42:57 PM8/7/16
to Node-RED
I believe the problems I saw with the new dashboard were due to power issues interrupting the installation. Now working well, thanks!

Julian Knight

unread,
Aug 10, 2016, 2:56:46 PM8/10/16
to Node-RED, node-red-...@googlegroups.com
None of my switch nodes had their labels set after the update and most were set to a custom icon instead of default though I don't think that I had changed anything. The switch names were correct but the labels blank.

The same was true of my text nodes & the gauges.

Most of my content was all squeezed onto a single tab after I tried the auto-group link. The original tabs were retained but with nothing in them.

I have 3 template outputs on a single tab, each in their own group. Each template outputs a UL list containing weather from different services and they all have vertical overflows (e.g. a vertical scroll bar). This using W10/Chrome with default zoom. The template is:
<UL>
    <li>Description: {{msg.payload.Description}}</li>
    <li>Today's Forecast: {{msg.payload.Todays_Forecast}}</li>
    <br />
    <li>Temperature: {{msg.payload.Temperature}}&deg;C</li>
    <li>Feels Like: {{msg.payload.Feels_Like}}&deg;C</li>
    <li>Dew Point: {{msg.payload.Dew_Point}}&deg;C</li>
    <li>Heat Index: {{msg.payload.Heat_Index}}</li>
    <br />
    <li>Humidity: {{msg.payload.Humidity}}%</li>
    <br />
    <li>Cloud Cover: {{msg.payload.Cloud_Cover}}%</li>
    <br />
    <li>Precipitation: {{msg.payload.Precipitation}}</li>
    <li>Precipitation Probability: {{msg.payload.Precip_Prob}}%</li>
    <li>Precipitation Type: {{msg.payload.Precip_Type}}</li>
    <br />
    <li>Pressure: {{msg.payload.Pressure}}mb</li>
    <li>Pressure Sealevel: {{msg.payload.Pressure_Sealevel}}mb</li>
    <br />
    <li>Wind Speed: {{msg.payload.Wind_Speed}}mph</li>
    <li>Wind Bearing: {{msg.payload.Wind_Bearing}}&deg;</li>
    <br />
    <li>Updated: {{msg.payload.timestamp}}</li>
</UL>

This template also overflows:
<div layout="row" layout-align="space-between center" 
        id="{{dev.topic}}"
        ng-repeat="dev in devTracker track by dev.topic"
        ng-class="$dev.containerClass ? 'rpt-container' : 'rpt-container1'">
    <p flex >{{dev.topic}}</p>
    <ng-md-icon icon="wb_sunny" size="32"
        title="Last Updated {{dev.lastUpdate}}"
        ></ng-md-icon>
</div>
 
<script>
// | orderBy:'topic'
//ng-style="{fill:(dev.payload==='Offline')?'red':'black'}" 

;(function(scope) {
    scope.devTracker = {}

    scope.$watch('msg', function(newVal, oldVal) {
        //console.dir(oldVal)
        //console.dir(newVal)
        // Wrap in try because first execution may be initial when msg is empty
        //try {
            //console.log('here %s, %s', newVal.topic, newVal.payload)
            var t = newVal.topic.split('/')
            newVal.topic = t[t.length - 1]
            
            newVal.lastUpdate = new Date()
            
            //newVal.containerClass = ! scope.devTracker[newVal.topic].containerClass
            //console.log( "Container Class: %s", newVal.containerClass)
            
            scope.devTracker[newVal.topic] = newVal
            
            if ( 'count' in scope.devTracker[newVal.topic] ) {
                scope.devTracker[newVal.topic].count += 1
            } else {
                scope.devTracker[newVal.topic].count = 1
            }
            
        //} catch (e) {
            // Nothing to do
        //}
        console.dir(scope.devTracker)
    })
})(scope)
</script>

<style>
    .rpt-container {
        opacity:1.0;
    }
    .rpt-container {
        opacity:0.1;
    }
    .rpt-container.ng-add {
        opacity:1;
        background-color:red;
    }
    .rpt-container.ng-remove {
        opacity:0.8;
        background-color:blue;
    }
    .rpt-container.ng-enter {
        -webkit-transition:20s linear all;
        -moz-transition:20s linear all;
        -o-transition:20s linear all;
        transition:20s linear all;
        opacity:1;
    }
    /* The ng-enter-active and ng-move-active are where the transition destination properties 
        are set so that the animation knows what to animate.
    */
    .rpt-container.ng-enter.ng-enter-active {
        opacity:0.1;
    }
</style>

Even this overflows:
<p>The numbers correspond to the numbers written on the plugs.</p>
<p>The number/letter combinations correspond to the labels on the white remote controls. The letter is for the slider beneath the buttons. <br>
Note: the un-numbered pair of buttons on the remote turns off/on the 3 lights in the hall and landing.</p>
<p>The name tells you where the plug is and/or what is normally plugged into it.</p>

Unfortunately, things are even worse on IE11. Although the weather panels don't overflow, the help panel above is totally messed up with text overwriting itself & the first template example sees and overflow and the icons on the wrong side overlapping the text. MS Edge is somewhere in-between, the weather panels don't overflow but everything else does, layout overall is close to Chrome's. Firefox is the same as Edge.

Also the following overflows as well and it didn't used to:
[{"id":"2f7d7fb7.9ae8d","type":"inject","z":"68da610e.9725a","name":"inject narrow","topic":"","payload":"<img src=\"http://i.giphy.com/FQaQtdbLnk676.gif\">","payloadType":"str","repeat":"","crontab":"","once":false,"x":341,"y":2930,"wires":[["3d2054da.c2dfac"]]},{"id":"3d2054da.c2dfac","type":"ui_template","z":"68da610e.9725a","group":"2d0a3989.1ab9e6","name":"Dynamic Inject Test","order":1,"width":"","height":"","format":"<div ng-bind-html=\"msg.payload\"></div>","storeOutMessages":true,"fwdInMessages":true,"x":559.3958129882812,"y":2921.33349609375,"wires":[[]]},{"id":"2d0a3989.1ab9e6","type":"ui_group","z":"68da610e.9725a","name":"Default","tab":"b5bad9f8.8a5918","disp":true,"width":"12"},{"id":"b5bad9f8.8a5918","type":"ui_tab","z":"68da610e.9725a","name":"Dynamic Injection Test","icon":"dashboard"}]


Pics:

Chrome: 

IE11: 


It would be really useful on large monitors in particular, if double-clicking on an item in the Tabs list were to edit it, trying to move across and hit the small target of the edit button can be a challenge :-)


The tab list is fixed height so on my 27" monitor, I still don't get to see a longer list which was slightly frustrating as I was trying to move things around between tabs.

Julian Knight

unread,
Aug 10, 2016, 2:57:55 PM8/10/16
to Node-RED, node-red-...@googlegroups.com
Sorry, all of that came across negatively and I didn't mean it to. The new UI is going to be great, just some teething problems.


On Wednesday, 10 August 2016 19:56:46 UTC+1, Julian Knight wrote:
None of my switch nodes had their labels set after the update and most were set to a custom icon instead of default though I don't think that I had changed anything. The switch names were correct but the labels blank.

...

Dave C-J

unread,
Aug 11, 2016, 9:32:40 AM8/11/16
to node...@googlegroups.com
Hi Julian, no worries,
The new template (if set to auto size)  tries to work out the vertical size of the contents and scales to fit.. - obviously needs a bit of a tweak. You can always override the vertical size manually if you need to.
For dynamic content then yes it should also re-size - so I will look at that - currently a browser refresh does seem to let the video fit.

Julian Knight

unread,
Aug 11, 2016, 1:07:57 PM8/11/16
to Node-RED
Yes, I'm sure there is lots to tweak. I couldn't easily see how to change the v-size though, is it just set with "height" or "max-height"?

Dave C-J

unread,
Aug 11, 2016, 1:09:16 PM8/11/16
to node...@googlegroups.com
Inline images 1

--
http://nodered.org
 
Join us on Slack to continue the conversation: http://nodered.org/slack
---
You received this message because you are subscribed to the Google Groups "Node-RED" group.
To unsubscribe from this group and stop receiving emails from it, send an email to node-red+unsubscribe@googlegroups.com.
To post to this group, send email to node...@googlegroups.com.
Visit this group at https://groups.google.com/group/node-red.
For more options, visit https://groups.google.com/d/optout.


--
regards

Dave Conway-Jones

Julian Knight

unread,
Aug 11, 2016, 8:13:27 PM8/11/16
to Node-RED
Ha, missed that!


On Thursday, 11 August 2016 18:09:16 UTC+1, Dave C-J wrote:
Inline images 1

On 11 August 2016 at 18:07, Julian Knight <j.kni...@gmail.com> wrote:
Yes, I'm sure there is lots to tweak. I couldn't easily see how to change the v-size though, is it just set with "height" or "max-height"?


On Thursday, 11 August 2016 14:32:40 UTC+1, Dave C-J wrote:
Hi Julian, no worries,
The new template (if set to auto size)  tries to work out the vertical size of the contents and scales to fit.. - obviously needs a bit of a tweak. You can always override the vertical size manually if you need to.
For dynamic content then yes it should also re-size - so I will look at that - currently a browser refresh does seem to let the video fit.

--
http://nodered.org
 
Join us on Slack to continue the conversation: http://nodered.org/slack
---
You received this message because you are subscribed to the Google Groups "Node-RED" group.
To unsubscribe from this group and stop receiving emails from it, send an email to node-red+u...@googlegroups.com.

To post to this group, send email to node...@googlegroups.com.
Visit this group at https://groups.google.com/group/node-red.
For more options, visit https://groups.google.com/d/optout.


--
regards

Dave Conway-Jones

Adan C Rosales

unread,
Aug 11, 2016, 10:40:27 PM8/11/16
to Node-RED, node-red-...@googlegroups.com
Great news!
Reply all
Reply to author
Forward
0 new messages