reconstruction of titanium beta phase ebsd
1,038 views
Skip to first unread message

Shuang Xie
Nov 6, 2015, 10:28:36 AM11/6/15
to MTEX
Hi there,
I am trying to use the mtex to reconstruct beta phase ebsd map by using "main_reconstruction(threshold)", but apparently this function is not exist...Is there something wrong or I missed? Since in someone's PhD thesis, he succeeded in reconstructing beta phase by using this function...By the way, I am trying to import the oxford inca or HKL to reconstruction, he used the OIM data analysis software..
Cheers,
Shuang Xie

Ralf Hielscher
Nov 6, 2015, 1:18:27 PM11/6/15
to MTEX
Hi Shuang Xie,
I'm afraid you have to be much more detailed. Almost nobody has read "someone's PhD thesis". Please try to read through the documentation of MTEX and afterwards ask detailed questions.
Ralf.
Shuang Xie
Nov 7, 2015, 12:32:57 PM11/7/15
to MTEX
Hi Ralf,
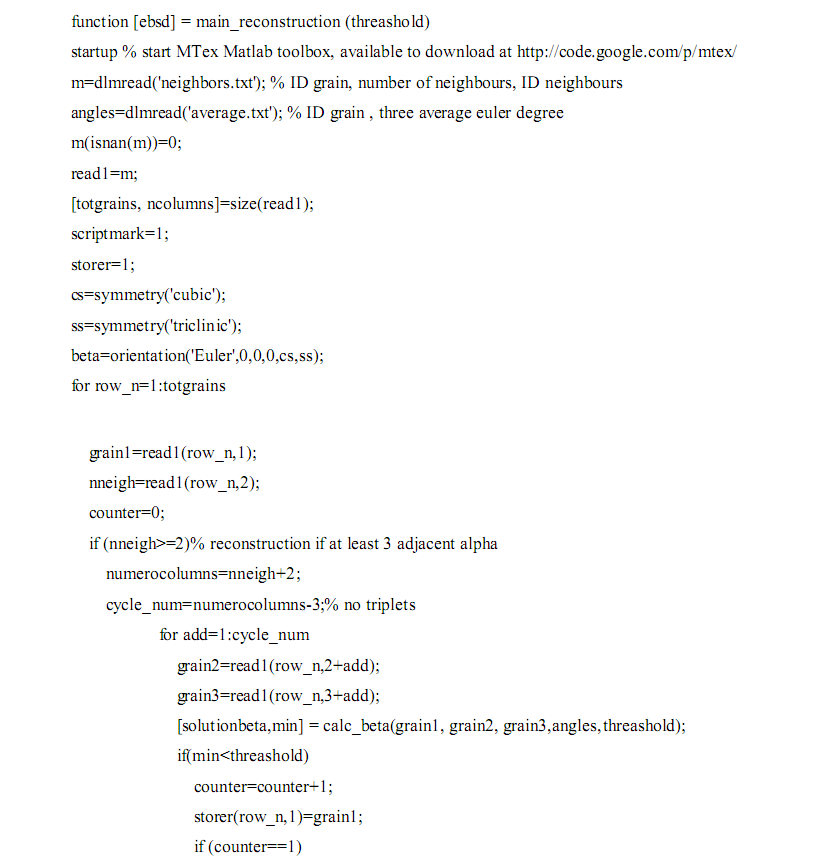
Thanks for your reply, the problem is that I have look through the documents and can not find a function to reconstruct beta phase. The attached is the step in the thesis how to start the function, if it can give you some idea...
Cheers,
Shuang Xie


Gerrit Ter Haar
Nov 9, 2015, 6:15:43 AM11/9/15
to mtex...@googlegroups.com
Hi Xie,
I am assuming you are referring to the author Simonelli?
/dspace-jspui/.../4/Thesis-2014-Simonelli.pdf
The author wrote the reconstruction functions himself and included the script at the end of his thesis.
I had the exact same problem in that I exported files using HKL, but the function are written to for OIM files.
I was, however able to reconstruct the prior beta grain boundaries though the method used in a paper in which the author identified the misorientation angles of the grains and then used Burgers Orientation Theory to plot the prior beta grains. I can post a link to the paper once im back in my office next week if you are interested.
regards
Gerrit
Shuang Xie
Nov 9, 2015, 8:50:53 AM11/9/15
to MTEX
Hi Gerrit,
Thanks for your kind offer.
Yes it is. It is the thesis of Simonelli, your situation is the same as I do- only access to HKL while he used the OIM exported files. Actually I can also plot out the boundary by comparing the smallest misorientation pixel by pixel. I trapped in solve out the prior beta orientation. As I need the average orientation of each grain, the grain ID and the location of each grain. However the HKL only could export the average grain orientation with grain id, but without where it locate...thus I could not locate each grain on the original map, which is really depressing, is there any idea to solve this problem?
Cheers,
Shuang
Ralf Hielscher
Nov 17, 2015, 5:43:45 PM11/17/15
to MTEX
Hi Shuang Xie,
computing the average orientation of each grain, the grain ID and the location of each grain is not a big deal in MTEX.
Ralf.
Shuang Xie
Nov 27, 2015, 10:38:00 AM11/27/15
to mtex...@googlegroups.com
Hi Ralf,
Could please list some major function's name to find out neighbour grain ID? It seem that I cam't find the function to find out adjacent grain ID looking through the documents...
Cheers,
Shuang Xie
Gerrit Ter Haar
Dec 1, 2015, 8:43:53 AM12/1/15
to mtex...@googlegroups.com
Hi Shuang,
I used the following function
[a,b] = neighbors(grains);
Generating the correct neighbors text file is however a hard work. (lots of matrix/cell manipulation and rearranging and loops).
I have been able to use Simonelli's code to generate beta phase ebsd data (took a few hours to run), but the results are very "noisy" with many arbitrary orientations scattered all over. The author has not included in his thesis the code for the function that he used: "orientation_map.m". I am not sure if he used some sort of filter in this function to filter out the "noise" in the results generated, or if the noise is due to a mistake on my part.
Hope this helps.
Regards
Gerrit
Shuang Xie
Jan 4, 2016, 11:53:06 AM1/4/16
to MTEX
Hi Gerrit,

Happy new year and something wrong with my gmail, so I just notice your reply.
The code for the neighbor calculation you provide seems to simple and I decide to post a new topic to ask, but thanks anyway.
For Sionelli's code, I also debug it and get it to run. The code I used is as follow to plot it out
cs=crystalSymmetry('cubic'); % I change it to crystalSymmetryss=specimenSymmetry('triclinic'); % I change it to specimenSymmetryebsd=loadEBSD_generic('ebsd_file.txt', 'CS', cs, 'SS', ss, 'ColumnNames', {'Euler1', 'Euler2', 'Euler3', 'x','y'}, 'Bunge'); plot(ebsd('indexed'),ebsd('indexed').orientations);% To plot out the orientation mapthe result is

However, even the noisy result I can not got, it is exactly as the same as the original.
I suspect maybe it is due to the different RD/TD definition between different software, as the stupid part is that I use INCA to do the scan, and the OIM could only receive HKL channel 5 data.
One question about the Sionelli's code, do you know why he choose the threshold as 30 at the beginning? It seems set as a big range to cover as much grains as possible, not like the definition like the misorientation between two grains, right?
By the way, the good news is that I have find out Sionelli's email and he is now working in Nottingham University, he replied in November to review his code but not receive any reply from him yet. If there any news from him, I will let you know right now.
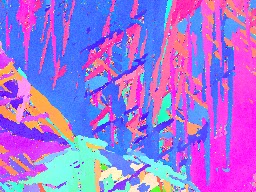
The following is the boundary I plot by using my own code and the different axis definition between different software.


If you could figure anything wrong from here or new idea, please let me know.
Best regards,
Shuang
Gerrit Ter Haar
Jan 22, 2016, 2:43:51 PM1/22/16
to mtex...@googlegroups.com
Hi Shuang,
Happy new year to you too! I've been away for a bit and only saw your mail recently. It is strange that you are getting the same plot. Are you sure you are not just plotting your original orientation map with the different crystal co-ordinate system. (cubic instead of hexagonal?)
I would maybe try to name the output file something else like: ebsd_1 or something.
To comment on your other question, yes, 30 degrees threshold is rather big. I played around different angles and found that 20 degrees or even 15 works fine except that less beta phase solutions are found. The code takes long to run, it might be that my computer is just really slow.
The solution plot that I end up getting after loadEBSD_generic etc is a bunch of beta orientation points/pixels not all of the same orientation in one beta grain. I then use the medianFilter with a F.neighbors value of about 10 to get even grains orientation. I then used the calcGrains and spline filter so smooth out the pixelated points.
I can sent you some screen shots when I'm back at my office computer.
kinds regard
Gerrit
--
If you want to reduce the number of emails you get through this forum login to https://groups.google.com/forum/?fromgroups=#!forum/mtexmail, click "My membership" and select "Don't send me email updates". You can still get emails on selected topics by staring them.
---
You received this message because you are subscribed to a topic in the Google Groups "MTEX" group.
To unsubscribe from this topic, visit https://groups.google.com/d/topic/mtexmail/Zc2t9qWeiys/unsubscribe.
To unsubscribe from this group and all its topics, send an email to mtexmail+u...@googlegroups.com.
Visit this group at https://groups.google.com/group/mtexmail.
For more options, visit https://groups.google.com/d/optout.
Shuang Xie
Jan 25, 2016, 5:06:31 PM1/25/16
to MTEX
Great to hear from you, expecting your result!
Gerrit Ter Haar
Jan 26, 2016, 6:02:54 AM1/26/16
to mtex...@googlegroups.com
Hi,
Have a look at some results of mine. I believe that reconstruction of a larger scan areas should also look a bit better.
If you have any ideas of how to improve the beta solution results, let me know, otherwise the method seems to work o.k. for now.
Question: do you know how te determine/distinguish the specific variants (12 alpha variants) from the function call: rotation = symmetrise(ori, cs,ss). I can get the Euler angles of "rotation" from: " rotation.Euler", but they don't match those mentioned by Simonelli on page 197 when I make the Euler anges of "ori" equal to (0, 0, 0)...
kind regards,
Gerrit
Shuang Xie
Jan 26, 2016, 8:55:34 AM1/26/16
to MTEX
Hi Gerrit,
I think there is potential to improve the beta resolution. The logic from Simonelli is to output the beta resolution when all the three grain misorientation are below threshold. In your case, I think you may try the burgers orientation 135,90,355 to 135,90,325(as I am facing this problem and try both of them and use the better one). The second thing is that he use the mean orientation of same pixel by add them together and average it, however it is apparently wrong. I recommend to use function "mean()" in mtex.
For your question, I am not sure... I am also facing the input data ipf colour legend problem as I create another topic. What can I suggest is that you can check the definition of "cs, ss", is there any chance you confused them with hcp and bcc?
Cheers,
Shuang Xie
Gerrit Ter Haar
Jan 30, 2016, 4:50:34 AM1/30/16
to mtex...@googlegroups.com
Hi,
Thanks so much for the help! the Burger's Orientation in Euler angles of (135, 90, 355) works much much better! Why does all the literature say 325? Why does 355 degrees work better?
regards
Gerrit
Shuang Xie
Feb 25, 2016, 9:55:50 AM2/25/16
to MTEX
Hi,
I know the problem. Some EBSD analysis software default set of the hexagonal crystal is [2-1-10]//RD(x) and
[0001]//ND(z), whilst the other is [2-1-10]//TD(y) and [0001]//ND(z), where they have a 30 degree rotation. The ref give different angle by using different default set. In the paper" Determination of the orientation of a parent beta grain from the orientation ....."by Michel Humber, Frances Wanger, etc, they referred 135, 90, 354.74 degree.
To be honest, it tortured me several months before realized it.
Hope this will help.
Best regards,
Shuang

Franklin Wang
Jun 15, 2016, 12:52:46 PM6/15/16
to MTEX
Hello You'll,
Thanks!
Franklin Wang
I am working on the grain reconstruction now and find your answers here. I am debuging of the main_function posted at the end of the thesis of Dr. Simonelli using MTEX-4.3.1 now. Do you two have any published/accepted manuscripts that I can referred?
Thanks!
Franklin Wang
Gerrit Ter Haar
Jun 21, 2016, 11:21:26 AM6/21/16
to mtex...@googlegroups.com
Hi,
I probably did at one stage. I also tried debugging the code at the end of last year using the older versions without much success.
I ended up re-writing the main_reconstruction.m code and editing the other .m file to work in version 4.3.1. and also to be able to extract all the needed information form the alpha phase imported data file.
I found the attached paper to be very helpful in explaining the methodology of reconstruction.
I will back in office next week if you require more details.
kind regards
Gerrit
Shuang Xie
Jun 26, 2016, 9:50:49 AM6/26/16
to MTEX
Hi,
Regards,
I am still facing some problem with these functions, I will publish a version based on v4.1.3 when I finish.
But for your question, I think you can do as follows:
beta(i)=s(i)*inv(d); %change inverse to inv
Regards,
Shuang Xie
Franklin Wang
Jun 26, 2016, 5:28:01 PM6/26/16
to MTEX
Shuang,
Thanks! I will have a try.
Regards!
Franklin Wang

向浩
Mar 7, 2019, 10:13:47 AM3/7/19
to MTEX

When you used Simonlli's code to reconstruct β phase, have you every met below bug? if you met, would you tell me how to solve it?
Thanks
Xiang
在 2016年6月26日星期日 UTC+2下午3:50:49,Shuang Xie写道:
在 2016年6月26日星期日 UTC+2下午3:50:49,Shuang Xie写道:
向浩
Mar 7, 2019, 10:52:29 AM3/7/19
to MTEX
Hi Gerrit Ter Haar:
在 2016年6月21日星期二 UTC+2下午5:21:26,Gerrit Ter Haar写道:
Good afternoon.
Have you ever met the bug shown below during your reconstruction of β phase? if you have met, how did you solve it? and if possible, would you mind sharing your code about reconstruction based on Simonelli's thesis?
Thank you very much

Xiang
在 2016年6月21日星期二 UTC+2下午5:21:26,Gerrit Ter Haar写道:
Reply all
Reply to author
Forward
0 new messages