mongodb 3.4.10 memory growth

Daniel Doyle
"bytes currently in the cache" : 42629567194,
"maximum bytes configured" : 56408145920,
"generic" : {
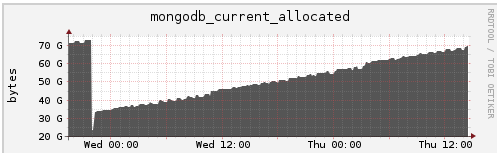
"current_allocated_bytes" : NumberLong("72999682360"),
"heap_size" : NumberLong("99688194048")
},
"tcmalloc" : {
"pageheap_free_bytes" : NumberLong("22580260864"),
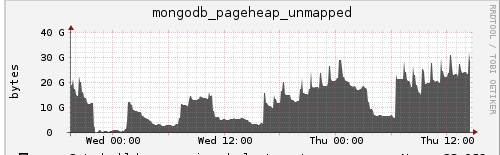
"pageheap_unmapped_bytes" : NumberLong("2185707520"),
"max_total_thread_cache_bytes" : NumberLong(1073741824),
"current_total_thread_cache_bytes" : 27332768,
"total_free_bytes" : NumberLong(1922543304),
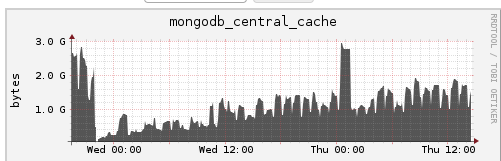
"central_cache_free_bytes" : NumberLong(1894941896),
"transfer_cache_free_bytes" : 268640,
"thread_cache_free_bytes" : 27332768,
"aggressive_memory_decommit" : 0,
"formattedString" : "------------------------------------------------\nMALLOC: 72999682360 (69617.9 MiB) Bytes in use by application\nMALLOC: + 22580260864 (21534.2 MiB) Bytes in page heap freelist\nMALLOC: + 1894941896 ( 1807.2 MiB) Bytes
in central cache freelist\nMALLOC: + 268640 ( 0.3 MiB) Bytes in transfer cache freelist\nMALLOC: + 27332768 ( 26.1 MiB) Bytes in thread cache freelists\nMALLOC: + 558653632 ( 532.8 MiB) Bytes in malloc metadata\nMALLOC: ------------\nMALLOC: = 98
061140160 (93518.4 MiB) Actual memory used (physical + swap)\nMALLOC: + 2185707520 ( 2084.5 MiB) Bytes released to OS (aka unmapped)\nMALLOC: ------------\nMALLOC: = 100246847680 (95602.8 MiB) Virtual address space used\nMALLOC:\nMALLOC: 7267027
Spans in use\nMALLOC: 177 Thread heaps in use\nMALLOC: 4096 Tcmalloc page size\n------------------------------------------------\nCall ReleaseFreeMemory() to release freelist memory to the OS (via madvise()).\nBytes relea
sed to the OS take up virtual address space but no physical memory.\n"
}
Based on some reading of issues like https://jira.mongodb.org/browse/SERVER-20104 I tried enabling aggressive decommit via the environment variable, but the overhead of doing that resulted in a massive overall performance drop so we reverted fairly quickly. There are a few other tcmalloc env variables like RELEASE_RATE or HEAP_LIMIT that may be relevant, but I figured it would be good to ask around first after trying a few in dev environment and managing to segfault mongo (such as the max heap size setting).
Attached is the current full output of serverStatus if that is helpful. As you can see the heap size is considerably lower right now, but it will grow over time until it looks like the above.
A few misc details -
1. The server is running in a replica set, but at the moment the secondary has been removed while we do some hardware changes.
2. The server is currently a single shard. This is an artifact from the 2.X days when we had to shard data to get around single threaded limitations of MMAP, but is a peculiarity so I wanted to point it out.
3. Our workflow is very heavily update based. We're storing time series data at a fairly regular interval, and documents contain "blocks" of time. One document for example represents a few hours worth of 60s samples, so the workflow each minute is to update an array in that document to add the value. These arrays are fixed size at which point a new doc is created, but I would think internally that the documents grow from their initial size.
I am happy to provide any additional information if I can. Thanks.
Daniel Doyle

Kevin Adistambha
Hi Daniel
Could you add more details please:
- Are you running with
--enableMajorityReadConcernsetting? - Could you post the output of
db.serverCmdLineOpts(),rs.conf(), and the content of any config files? - Do you have big databases? How many collections do you have in the system? The output of
db.stats()per database would help to determine this. - Could you post the directory listing of your
dbpaththat includes the file sizes, e.g. output ofls -l - Do you have big aggregation queries running all the time?
This system was upgraded from 3.0.12 to 3.4.10 including the steps along the way such as converting config servers to wiredtiger.
Did you upgrade to MongoDB 3.2 in-between? Note that the supported upgrade path involves upgrading through every intermediate major versions.
Also, did you change the replica set protocol version during the upgrade process?
we will be trying to downgrade to 3.2 to see if that helps anything.
Without knowing more about your use case, I would venture to say that it’s likely to be better to upgrade to the current version of 3.6.2 instead of moving downward to the 3.2 series.
Best regards
Kevin
Daniel Doyle
On Tuesday, January 16, 2018 at 7:40:02 PM UTC-5, Kevin Adistambha wrote:
Hi Daniel
Could you add more details please:
- Are you running with
--enableMajorityReadConcernsetting?
- Could you post the output of
db.serverCmdLineOpts(),rs.conf(), and the content of any config files?
- Do you have big databases? How many collections do you have in the system? The output of
db.stats()per database would help to determine this.
- Could you post the directory listing of your
dbpaththat includes the file sizes, e.g. output ofls -l
- Do you have big aggregation queries running all the time?
This system was upgraded from 3.0.12 to 3.4.10 including the steps along the way such as converting config servers to wiredtiger.
Did you upgrade to MongoDB 3.2 in-between? Note that the supported upgrade path involves upgrading through every intermediate major versions.
we will be trying to downgrade to 3.2 to see if that helps anything.
Without knowing more about your use case, I would venture to say that it’s likely to be better to upgrade to the current version of 3.6.2 instead of moving downward to the 3.2 series.
Best regards
Kevin
Kevin Adistambha
Hi Daniel
Unfortunately there is nothing that points to a definitive issue from the serverStatus output that you posted. There are a number of databases and indexes, but I think it’s still a relatively manageable number. None of the information you posted pointed to any obvious cause either.
It would be helpful if you could post about 3-4 output of db.serverStatus() within a minute or so from each other during the height of the issue. Hopefully this could point to a reason.
In the meantime, you might want to check out the Production Notes and see if there are any settings that were missed/non-optimal.
Best regards
Kevin
Daniel Doyle
Daniel Doyle
Kevin Adistambha
Hi Daniel
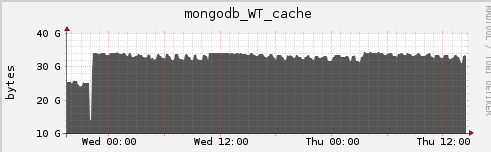
From the mongodb_WT_cache graph you posted, the WiredTiger cache seems to be holding steady at ~32 GB, which is expected if you set the WiredTiger cache to 40 GB. WiredTiger will use up to 80% of the configured cache size, then will try to keep cache utilization at this level for performance reasons.
Other than the mongodb_current_allocated graph, everything else looks expected. I would like to reconfirm that other than this constantly climbing allocation, is everything else in the database is running as expected? E.g. no stalling, drop in throughput, unexpected shutdowns, etc.?
In the past, have you seen the mongodb_current_allocated graph to plateau at some point?
It’s doing a fairly large aggregate query during that time
The stuff around midnight is some more large jobs running
It is entirely possible that the job you’re doing simply needs that much memory to run.
Could you elaborate on the large aggregate queries? How large are we talking about, e.g. the number of documents, the average size of the documents, whether it uses the $out stage, etc. It might be useful to see the aggregation query and some example documents to get a sense of the scale. A bit more insight into the other “large jobs” would be useful to know as well. Could you elaborate on those large jobs?
Finally, if possible, could you perform these steps to collect more information?
1. Run mongod with mongod --setParameter heapProfilingEnabled=true, or add this entry in your config file:
setParameter:
    heapProfilingEnabled: true
This will run mongod in a heap profiling mode, which is a troubleshooting mode.
2. Run this script in the server to collect serverStatus data every minute:
mongo --eval "while(true) {print(JSON.stringify(db.serverStatus({tcmalloc:true}))); sleep(60*1000)}" > serverStatus.out
Ideally, the script should be run after restart, and let running for ~2 days (the length of the graphs you posted). Longer would definitely be better. It will produce a serverStatus() output every minute. Note that there are no identifiable information in the serverStatus() output, it only contains various metrics of what the server is doing at that point in time.
Please post the resulting serverStatus.out. It’s a text file, so you can compress it with zip or similar.
Best regards
Kevin
Daniel Doyle
On Thursday, February 8, 2018 at 9:26:40 PM UTC-5, Kevin Adistambha wrote:
Hi Daniel
From the
mongodb_WT_cachegraph you posted, the WiredTiger cache seems to be holding steady at ~32 GB, which is expected if you set the WiredTiger cache to 40 GB. WiredTiger will use up to 80% of the configured cache size, then will try to keep cache utilization at this level for performance reasons.
Other than the
mongodb_current_allocatedgraph, everything else looks expected. I would like to reconfirm that other than this constantly climbing allocation, is everything else in the database is running as expected? E.g. no stalling, drop in throughput, unexpected shutdowns, etc.?In the past, have you seen the
mongodb_current_allocatedgraph to plateau at some point?
It’s doing a fairly large aggregate query during that time
The stuff around midnight is some more large jobs runningIt is entirely possible that the job you’re doing simply needs that much memory to run.
Could you elaborate on the large aggregate queries? How large are we talking about, e.g. the number of documents, the average size of the documents, whether it uses the
$outstage, etc. It might be useful to see the aggregation query and some example documents to get a sense of the scale. A bit more insight into the other “large jobs” would be useful to know as well. Could you elaborate on those large jobs?
Finally, if possible, could you perform these steps to collect more information?
1. Run
mongodwithmongod --setParameter heapProfilingEnabled=true, or add this entry in your config file:setParameter: heapProfilingEnabled: trueThis will run
mongodin a heap profiling mode, which is a troubleshooting mode.2. Run this script in the server to collect
serverStatusdata every minute:mongo --eval "while(true) {print(JSON.stringify(db.serverStatus({tcmalloc:true}))); sleep(60*1000)}" > serverStatus.outIdeally, the script should be run after restart, and let running for ~2 days (the length of the graphs you posted). Longer would definitely be better. It will produce a
serverStatus()output every minute. Note that there are no identifiable information in theserverStatus()output, it only contains various metrics of what the server is doing at that point in time.Please post the resulting
serverStatus.out. It’s a text file, so you can compress it withzipor similar.
Best regards
Kevin
Daniel Doyle
Kevin Adistambha
Hi Daniel
Thanks for the data. From what you posted, it appears that your workload actually requires all that memory.
By default (in MongoDB), tcmalloc is not set to aggressively decommit allocated memory. This was done to ensure that if this memory is required quite soon in the future, tcmalloc doesn’t have to go through a deallocate-reallocate cycle that would be detrimental to performance. The side effect of this setting is that memory is not promptly released back to the OS, which is what you are seeing in your case.
By plotting the tcmalloc pageheap_free_bytes metric, it can be observed that there is a large portion of memory (26 GB at peak) that was allocated, but was not released back to the OS. However, the point below illustrates a good reason for not releasing it:

Note in the graph above, at point B, there was 17 GB that was considered “free” at 2018-02-11T14:51:19Z. However, this number drops to just 69 MB at point C 2018-02-11T14:52:24Z — in about one minute, almost all 17 GB is completely reused:

The fact that turning on aggressive decommit leads to poor performance seems to confirm that the process does actually need all those resources. This poor performance would mean that mongod deallocated memory that was being reallocated again later.
There are some things that you could try to alleviate this situation:
- If you’re able to provision more memory, you might be able to observe memory usage plateau at some point.
- Given the current hardware, the workload seems to require more resource than what is available. You might be able to shard and distribute the load across more servers.
Best regards
Kevin