Mongo 3.2 on Win 2008 R2 suddenly consumes all RAM

Nick Fenwick
We've run Mongo 3.0.x for some time without apparent problems. We have two main collections in a single database:
- one small collection that's basically read-only and rarely used
- one large collection that's an access_log for our IIS web server, storing a document per request and logging request and response details and payloads. It's about 25Gb now.
Both are in wiredTiger engine and seem to perform fine.
We also run MSSQL on the same machine due to financial constraints. I'm guessing this is not ideal, but the two should be able to run well together. Normally, this 12Gb RAM machine has MSSQL at about 3Gb and Mongo at about 200Mb.
We recently found RAM usage reported in Task Manager at 99%. Viewing the mongod process in the Process List showed it only using a few hundred Mb of RAM. Restarting the Mongo service immediately resolved the RAM usage.
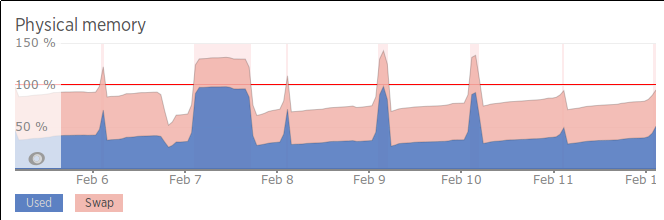
The problem has occurred about once a day all week, each time the RAM usage suddenly spikes, no process seems to be actually allocating all the RAM, each time restarting the Mongo service immediately reclaims the 8 or 9 Gb of RAM that were suddenly allocated. I'll attach a graph captured by NewRelic over the past week, you can see the peaks during which time mongo is hogging RAM until it's restarted.
I tried setting storage.wiredTiger.engineConfig.cacheSizeGB: 2 in the cfg file in normal YAML format but this did not help. The documentation at https://docs.mongodb.org/manual/faq/storage/ states:
""""
The storage.wiredTiger.engineConfig.cacheSizeGB only limits the size of the WiredTiger cache, not the total amount of memory used by mongod. The WiredTiger cache is only one component of the RAM used by MongoDB. MongoDB also automatically uses all free memory on the machine via the filesystem cache (data in the filesystem cache is compressed).
In addition, the operating system will use any free RAM to buffer filesystem blocks.
To accommodate the additional consumers of RAM, you may have to decrease WiredTiger cache size.
""""This does not tell me how to configure the 'rest' of mongo to limit its RAM usage. What else can I configure to control RAM allocation?
We tried upgrading to 3.2.1 with no luck.
I did find that the installer for the 64 bit 2008R2+ version of Mongo refused to install, complaining about a TryAcquireSRWLockExclusive entry point not being found. I had to install the legacy 64 bit version instead. I could not see why the 2008R2+ version wouldn't instal on our fully patched up Windows 2008R2 system.
We're on Rackspace, and their engineers recommended RAMMap, which I ran but didn't seem to show which process was hogging RAM. There was a single large Mapped Files element, which I'm guessing is Mongo, but no clues.
We've tried increasing logging for a few components (query, index, network) to help identify what's going on at the time of failure, but it hasn't turned up a smoking gun. It does appear that our C# app that's inserting into the access_log collection may be badly behaved, e.g. logging until one point of failure today:
2016-02-12T09:09:02.803Z I NETWORK [initandlisten] connection accepted from 172.24.32.126:57724 #444 (5 connections now open)
2016-02-12T09:09:02.875Z D NETWORK [conn436] SocketException: remote: 172.24.32.126:56878 error: 9001 socket exception [CLOSED] server [172.24.32.126:56878]
2016-02-12T09:09:02.905Z I NETWORK [conn436] end connection 172.24.32.126:56878 (3 connections now open)
2016-02-12T09:11:01.110Z D NETWORK [conn444] Socket recv() errno:10054 An existing connection was forcibly closed by the remote host. 172.24.32.126:57724
2016-02-12T09:11:01.110Z D NETWORK [conn367] Socket recv() errno:10054 An existing connection was forcibly closed by the remote host. 172.24.32.126:51737
2016-02-12T09:11:01.110Z D NETWORK [conn444] SocketException: remote: 172.24.32.126:57724 error: 9001 socket exception [RECV_ERROR] server [172.24.32.126:57724]
2016-02-12T09:11:01.110Z D NETWORK [conn367] SocketException: remote: 172.24.32.126:51737 error: 9001 socket exception [RECV_ERROR] server [172.24.32.126:51737]
2016-02-12T09:11:01.110Z I NETWORK [conn444] end connection 172.24.32.126:57724 (3 connections now open)
2016-02-12T09:11:01.119Z I NETWORK [conn367] end connection 172.24.32.126:51737 (3 connections now open)
2016-02-12T09:11:01.123Z D NETWORK [conn437] Socket recv() errno:10054 An existing connection was forcibly closed by the remote host. 172.24.32.126:57297
2016-02-12T09:11:01.123Z D NETWORK [conn437] SocketException: remote: 172.24.32.126:57297 error: 9001 socket exception [RECV_ERROR] server [172.24.32.126:57297]
2016-02-12T09:11:01.123Z I NETWORK [conn437] end connection 172.24.32.126:57297 (3 connections now open)
2016-02-12T09:11:38.415Z I NETWORK [initandlisten] connection accepted from 172.24.32.126:57805 #445 (2 connections now open)
2016-02-12T09:11:38.876Z I NETWORK [initandlisten] connection accepted from 172.24.32.126:57807 #446 (3 connections now open)
2016-02-12T09:11:38.896Z I NETWORK [initandlisten] connection accepted from 172.24.32.126:57808 #447 (4 connections now open)
2016-02-12T09:11:38.896Z I NETWORK [initandlisten] connection accepted from 172.24.32.126:57809 #448 (5 connections now open)
172.24.32.126 is our app server. If it were slow death by memory leak due to connections not closing gracefully, I'd expect to see a slow creep of RAM usage eventually resulting in 99% RAM, not the sudden death that we're seeing.
Is it normal the mongod allocates RAM but it's not visible in Task Explorer? What config can we change to ensure mongo does not exhaust physical RAM, and plays nice alongside MSSQL?
We're going to move this mongod to a cluster of 3 dedicated Linux servers pretty soon, hopefully then the problem will just go away.
Thanks
Nick

Kevin Adistambha
Hi all, got a serious problem in our production environment and not sure how to investigate. Symptoms are that a 3.x mongod instance on Win 2008R2 runs fine for a day or two, then suddenly spikes RAM usage and other components on the machine crash as they run out of RAM.
Hi Nick,
By default, MongoDB will try to use as much of the system’s memory as possible to achieve the highest performance. MongoDB uses two types of memory: the memory specifically allocated by the OS for mongod (which includes the WiredTiger cache), and the filesystem cache (which is under the OS’s control). The drop in memory usage that you observed when you killed the mongod process is likely caused by the release of both types of memory.
This does not tell me how to configure the ‘rest’ of mongo to limit its RAM usage. What else can I configure to control RAM allocation?
The --wiredTigerCacheSizeGB only limits the WiredTiger cache, not the amount of memory consumed by mongod. There’s currently no global limit one can set to limit the amount of memory used by mongod. Also the OS may use additional memory for buffering, which may be released to other processes if there’s memory pressure.
There are a number of things that may cause the memory issue that you are seeing, for example:
- Any queries that are being performed in MongoDB that correspond to the increase in memory usage. This may show up in the MongoDB log as a slow query.
- Any significant activities in MSSQL or other processes during that time.
- Any administrative operations that are being performed around that time (e.g. backup, reporting, etc.).
- Any correlation to the period where your C# app is producing socket exceptions in MongoDB.
- Usage pattern and memory consumption of any other processes beside
mongodand MSSQL running on the machine.
Having said that, it is apparent that your system is being overloaded at the moment. You may find information about the recommended production settings for MongoDB in the Production Notes useful. Specifically you may want to check out :
We’re on Rackspace, and their engineers recommended RAMMap, which I ran but didn’t seem to show which process was hogging RAM. There was a single large Mapped Files element, which I’m guessing is Mongo, but no clues.
In RAMMap, you can find the filename from the “File Summary” tab.
I did find that the installer for the 64 bit 2008R2+ version of Mongo refused to install, complaining about a TryAcquireSRWLockExclusive entry point not being found. I had to install the legacy 64 bit version instead. I could not see why the 2008R2+ version wouldn’t instal on our fully patched up Windows 2008R2 system.
Could you elaborate on exactly which binary you tried to install (e.g. the filename, msi or zip version)? Also see Install MongoDB on Windows for more information on MongoDB Windows installation.
Best regards,
Kevin