Operating Characteristic Curve
75 views
Skip to first unread message

BE PE
Mar 30, 2017, 5:16:50 PM3/30/17
to mirt-package
Hi,
First I'd like to say thanks for a terrific R package!
I wonder if it's possible, in some way, to plot so called OCCs. It's possible in the package ltm, but for various reasons I'd prefer to do it in mirt. My understanding is that trace lines show each category with adjacent categories subtracted (relative probabilities, I guess), whereas OCCs are absolute probabilities (please correct me if I'm wrong).
I also have a general IRT question: Is it possible to correlate residuals? (Why not?)
Cheers!

Phil Chalmers
Mar 30, 2017, 9:04:02 PM3/30/17
to BE PE, mirt-package
On Thu, Mar 30, 2017 at 5:16 PM, BE PE <perss...@gmail.com> wrote:
Hi,
First I'd like to say thanks for a terrific R package!
I wonder if it's possible, in some way, to plot so called OCCs. It's possible in the package ltm, but for various reasons I'd prefer to do it in mirt. My understanding is that trace lines show each category with adjacent categories subtracted (relative probabilities, I guess), whereas OCCs are absolute probabilities (please correct me if I'm wrong).
See the plot() generic, particularly the 'type' input, as well as itemplot(). There are numerous examples of this through the help files as well.
I also have a general IRT question: Is it possible to correlate residuals? (Why not?)
What's a residual for a categorical variable? That should answer you question.
--
Cheers!
You received this message because you are subscribed to the Google Groups "mirt-package" group.
To unsubscribe from this group and stop receiving emails from it, send an email to mirt-package+unsubscribe@googlegroups.com.
For more options, visit https://groups.google.com/d/optout.
BE PE
May 9, 2017, 5:54:34 PM5/9/17
to mirt-package, perss...@gmail.com
Hi,
I have to return to this. Maybe I used inappropriate terminology. What I'm looking for is cumulative response curves, and I can't find any examples of that in the documentation. Please point me in the right direction.
I have to return to this. Maybe I used inappropriate terminology. What I'm looking for is cumulative response curves, and I can't find any examples of that in the documentation. Please point me in the right direction.
Cheers!
To unsubscribe from this group and stop receiving emails from it, send an email to mirt-package...@googlegroups.com.
Phil Chalmers
May 9, 2017, 5:56:58 PM5/9/17
to BE PE, mirt-package
On Tue, May 9, 2017 at 5:54 PM, BE PE <perss...@gmail.com> wrote:
Hi,
I have to return to this. Maybe I used inappropriate terminology. What I'm looking for is cumulative response curves,
I'm not familiar with that term. If you know how to do it in ltm then please post that code and we can help you figure out how to do it in mirt.
To unsubscribe from this group and stop receiving emails from it, send an email to mirt-package+unsubscribe@googlegroups.com.
BP
May 9, 2017, 7:26:47 PM5/9/17
to mirt-package, perss...@gmail.com
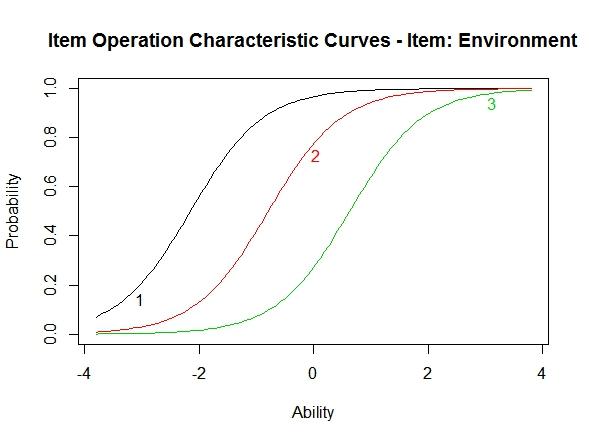
OK, so what I want is called "OCCu" in ltm (item operation characteristic curves) in ltm. What I find in mirt is ICCs (category characteristic curves).
library(mirt)
library(ltm)
test <- ltm::grm(Science)
ltm::plot.grm(test, type = "OCCu")
#ltm::plot.grm(test, type = "ICC") is the same as itemplot(x, type="trace") in mirt

I've seen these described as cumulative response curves as well, although IRT terminology can get quite confusing, as many things seem to have multiple names. My understand is that each ICC is calculated by subtracting adjacent probabilities, and OCCs are curves for each response category or higher.
Phil Chalmers
May 9, 2017, 9:54:34 PM5/9/17
to BP, mirt-package
I see. No, those don't exist in mirt (they are kind of weird, no? I don't see why they are more useful than the probability plots themselves.....). You could of course build them up manually, but I don't really have any interest in adding these in natively.
#-------------------------------------------------------------------------------------------
library(mirt)
mod <- mirt(Science, 1)
Theta <- matrix(seq(-4,4,length.out=1000))
ii <- extract.item(mod, 1)
P <- probtrace(ii, Theta)
cP <- t(apply(P, 1, cumsum))[,-4]
cPdf <- data.frame(p = 1 - as.numeric(cP), q = as.numeric(cP),
Theta=Theta, cat = rep(1:3, each = nrow(cP)))
xyplot(p ~ Theta, cPdf, group = cPdf$cat, type = 'l', auto.key = TRUE) # type = 'OCCu'
xyplot(q ~ Theta, cPdf, group = cPdf$cat, type = 'l', auto.key = TRUE) # type = 'OCCl'
# compare
dat <- Science
library(ltm)
lmod <- ltm::grm(dat)
plot.grm(lmod, type = 'OCCu')
plot.grm(lmod, type = 'OCCl')
Phil
To unsubscribe from this group and stop receiving emails from it, send an email to mirt-package+unsubscribe@googlegroups.com.
BP
May 10, 2017, 2:20:39 AM5/10/17
to mirt-package, perss...@gmail.com
Weird or not, I actually think they're simpler to understand. Thanks a lot for the code (and your, usual, quick help)!
Reply all
Reply to author
Forward
0 new messages