Unusual Patterns in MaxEnt Output.
29 views
Skip to first unread message

James Hansen
Feb 28, 2018, 7:41:31 AM2/28/18
to Maxent
Hi,
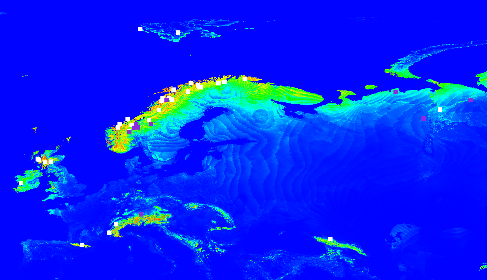
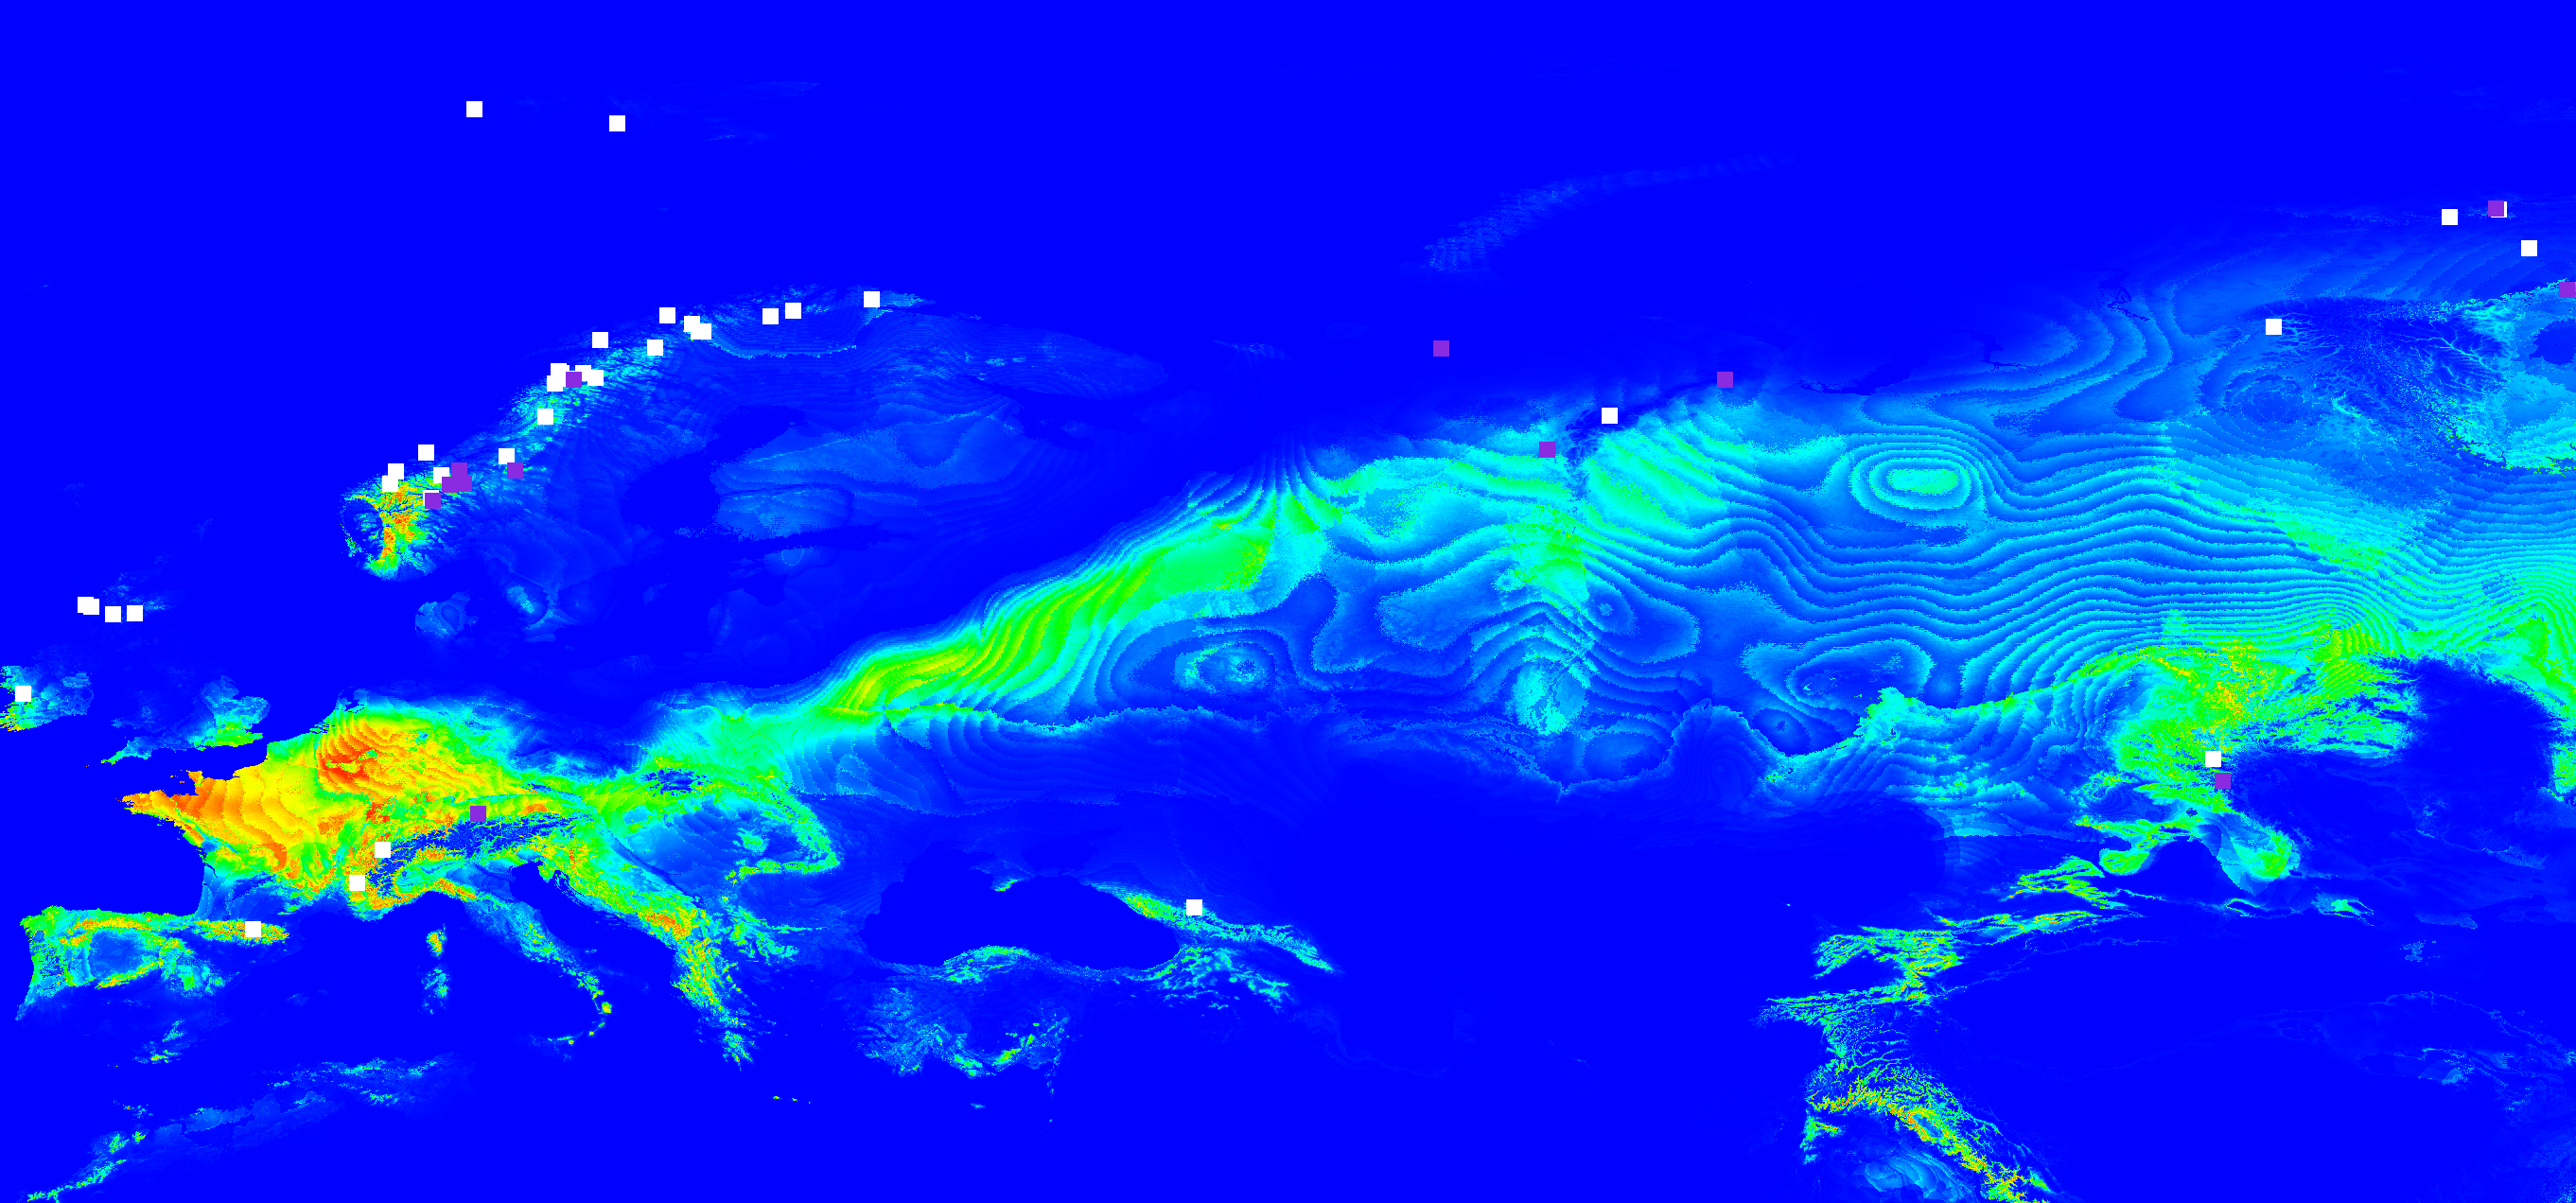
I've been running MaxEnt on a species with a holarctic distribution and the outputs will often have areas of strange banded or striped patterns in the predicted suitability (see attached cropped images). I'm wondering if these types of patterns are normal or if they represent an issue in some way with how I ran the model. I've been using WorldClim Version 1 Bioclimatic variables in all the runs as .bil files. After downloading the files I clipped them in ArcMap using Raster clip to better fit the holarctic region. I've run the model on current climate, and projected it using mid-holocene, last glacial maximum, and last inter-glacial, all using WorldClim files in .bil format and these patterns turn up in all of the outputs. The MaxEnt outputs are the default ascii files. The original WorldClim files, when I worked with them in ArcMap, did not have define spatial references but they seem to display fine in ArcMap with other files that are in GCS_WGS_1984. I don't know if not having a defined spatial reference matters when using the files in MaxEnt? Hopefully this is enough information for someone to help me with this issue.
Reply all
Reply to author
Forward
0 new messages