Re: Response Curve
157 views
Skip to first unread message

Francisco Rodriguez Sanchez
Mar 18, 2014, 5:47:26 AM3/18/14
to max...@googlegroups.com
Hi Gabriele,
It's difficult to know without seeing the data, but maybe class 0 is rather rare in your study area (much more than class 1)? In that case, if 25% (24/94) of your occurrences fall within landscape class 0, Maxent may interpret that it is a very suitable habitat, because a quarter of all occurrences fall within a very limited area. In the absence of other information, that suggests that class 0 would a preferred habitat...
I'm just guessing... there may be other explanations
Cheers
Paco
El 17/03/2014 04:26, Gabriele escribió:
Hello everyone,
I am using Maxtent for modelling the distribution of a species of mouse based on 94 presence locations.
One of the variables I am using is a categorical surface with two classes (class 1 = low fire frequency; and class 0 = high fire frequency). Although 70 out of 94 samples fall in class 1, the response curve for that variable indicates an higher suitability of class 0. Even when I use only that variable in my model, I obtain the same result and the output map indicates that the areas with the higher probability of suitable conditions are class 0.
I am a bit confused because, considering the vast majority of samples falls in class 1, I expected Maxtent to produce the opposite result
I would greatly appreciate your opinion on this.
Thanks.
Regards,
Gabriele
This message is intended for the addressee named and may contain confidential information. If you are not the intended recipient, please delete it and notify the sender. Views expressed in this message are those of the individual sender, and are not necessarily the views of their organisation. --
You received this message because you are subscribed to the Google Groups "Maxent" group.
To unsubscribe from this group and stop receiving emails from it, send an email to maxent+un...@googlegroups.com.
To post to this group, send email to max...@googlegroups.com.
Visit this group at http://groups.google.com/group/maxent.
For more options, visit https://groups.google.com/d/optout.
--
Dr Francisco Rodriguez-Sanchez
Integrative Ecology Group
Estacion Biologica de Doñana - CSIC
Avda. Americo Vespucio s/n
41092 Sevilla (Spain)
http://sites.google.com/site/rodriguezsanchezf

Gabriele
Mar 18, 2014, 9:06:55 PM3/18/14
to max...@googlegroups.com
Hi Paco,
Thank you very much for your reply.
I have had a closer look at my data and ran the simple model (i.e., based on 1 categorical variable only) again.
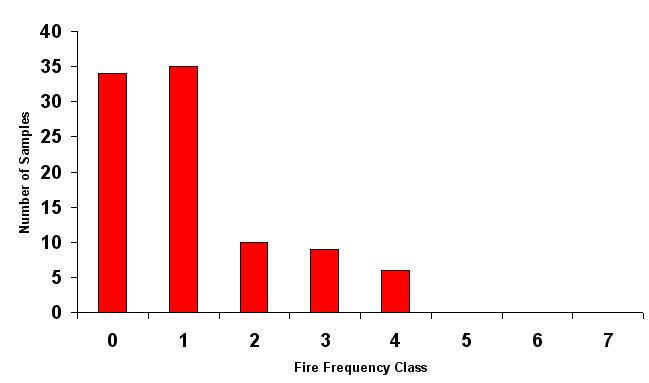
This time I decided to not reclassify my fire frequency layer (i.e., number of fires in the previous 20 years) in two classes (i.e., low fire frequency and high fire frequency) as I did the first time. I used the original existing classes (i.e., 8) which range from 0 (no fire in the previous 20 years) to 7 (7 fires in the previous 20 years). The percentage cover of each fire frequency class within my study area is: class 0 = 60%, class 1 = 24%, class 2 = 10%, class 3 = 4%, class 4 = 1%, class 5, 6 and 7 <1%. The distribution of my presence locations (i.e., 94) across the 8 fire frequency classes is shown in Figure 1 (please, see attached file). Basically, the vast majority of my samples falls within class 0 and class 1. There are not any sample in class 5 to 7.
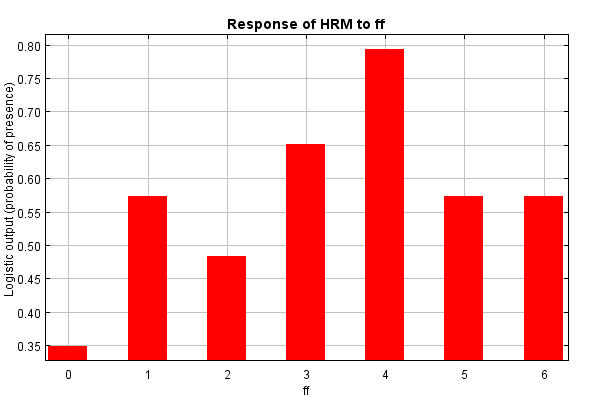
Using Maxent, the response curve for fire frequency (i.e., defined as "ff" in Figure 2) indicates that class 4 provides the highest probability of suitable conditions.....and class 5 and 6 are almost as good as class 1, although I have no samples falling within those two classes.
I am not sure whether I am doing something "technically" wrong or I am misinterpreting the output.
Thanks again for your help. Any feedback would be greatly appreciated.
Thanks.
Regards,
Gab
Francisco Rodriguez Sanchez
Mar 20, 2014, 5:55:56 AM3/20/14
to max...@googlegroups.com
Hi Gabriele,
Thanks for the additional info. I don't think you are doing anything wrong... Class 4 appears as the most suitable because you have about 7 occurrences (ie **7.5%** of the occurrences) in just **1%** of the area. So, even if there are only 7 presences there, they are concentrated in a very rare habitat, which thus is interpreted as very suitable.
If you compare with class 1, for instance, there are about 35 occurrences (ie **37%** of the total occurrences) in **24%** of the area. That is a much lower ratio than that for class 4 (where you had 7 occurrences in 1% of the area). Hence, class 1 appears as less suitable than class 4.
Finally, class 0 has about 34 occurrences (ie like class 1), but in a much larger area (60% of the total area), so it is interpreted as a habitat of lower suitability. Does it make sense?
Hope this helps
Cheers,
Paco
Gabriele
Mar 20, 2014, 7:02:05 PM3/20/14
to max...@googlegroups.com
Hi Paco,
Thank you very much for your reply.
Yes it makes sense, thank you for very much your help.....the only thing that is still not totally clear to me is how Maxent is handling class 5 and 6. I do not have any sample in those classes, but they are still considered suitable for the species.
Any idea?
Thanks again.
Regards,
Gab
Francisco Rodriguez Sanchez
Mar 21, 2014, 5:16:38 AM3/21/14
to max...@googlegroups.com
Hi Gabriele,
Glad it helped. For classes 5 and 6, in the absence of any occurrence, Maxent is probably giving them suitability values matching the estimated average prevalence. Their suitability is around 0.5, i.e. a 'neutral' role, not being either suitable (close to 1) or unsuitable (close to 0). There is not evidence about the relative suitability of these classes.
Cheers,
Paco
This message is intended for the addressee named and may contain confidential information. If you are not the intended recipient, please delete it and notify the sender. Views expressed in this message are those of the individual sender, and are not necessarily the views of their organisation. --
You received this message because you are subscribed to the Google Groups "Maxent" group.
To unsubscribe from this group and stop receiving emails from it, send an email to maxent+un...@googlegroups.com.
To post to this group, send email to max...@googlegroups.com.
Visit this group at http://groups.google.com/group/maxent.
For more options, visit https://groups.google.com/d/optout.
Gabriele
Mar 26, 2014, 12:30:39 AM3/26/14
to max...@googlegroups.com
Thank you very much for your help Paco!

caitlin...@gmail.com
Apr 3, 2014, 9:18:37 AM4/3/14
to max...@googlegroups.com
Hi Paco,
I have been reading through this forum and it seems that you are quite the Maxent expert! I decided to reply to this post since I am having the same issue that Gabriele had in terms of finding in my response curves that habitat with few to no presence points were showing higher probabilities than habitat where the species is known to occur (Im looking at Florida panther habitat use and the response curves show me that there is a higher probability of a panther being in a low intensity urban environment than in upland habitat, which is their preferred habitat class.). Your explanation makes sense when it comes to having a few points in a habitat class that does not cover a lot of area, but in terms of when no presence points fall within a habitat class...do you know of a way to adjust the model so that it does not give these classes a neutral role, as you suggest that is what Maxent is doing.
Also, I am confused about what set of response curves to use as Maxent produces two. Is there one that better represents how each variables affects the probability of presence?
Thanks!
Francisco Rodriguez Sanchez
Apr 3, 2014, 1:47:02 PM4/3/14
to max...@googlegroups.com
Hi Caitlin,
Thanks for the kind words but I'm far from an expert and, more importantly, there are many other people who contribute with excellent insights and much more often than I do (e.g. John Baumgartner, Dan Warren or Sam Veloz to name just a few).
Actually I don't have much experience with categorical variables and don't have an answer to your question on how to deal with habitat classes with few or no presence records. In a GLM-like approach, such habitats would probably have largely uncertain (or unidentifiable) effects, as we can't really tell how suitable they are from the available data. Instead, Maxent seems to adjudicate them a neutral role, with suitability matching the average prevalence of the study area (note the prevalence can be specified ad hoc). If you have no records for such rare habitats, why would you want to give them a low suitability value? They might also be highly suitable; we just don't happen to have the data to ascertain the effects. If the habitat is really common with no occurrences there, doesn't Maxent give it a low suitability value?
Sorry not to have a better answer at the moment. Hope others can chime in to clarify.
Best wishes,
Paco
caitlin...@gmail.com
Apr 6, 2014, 2:30:24 PM4/6/14
to max...@googlegroups.com
Hi Paco,
Thanks for your response. It gives me some more things to think about! In relation to your questions, due to what we know about Florida panthers from years of telemetry data, low intensity urban is not considered good habitat for panthers...especially compared to upland forest. I think my solution will be to take this habitat class out of the analysis since I am not interested in what habitat panthers are selecting in urban environments, I am interested in their nighttime movement on cattle ranches.
Thanks for your help!
Caitlin
Reply all
Reply to author
Forward
0 new messages