ENMeval predictions
1,415 views
Skip to first unread message

Sofia Granados
Nov 2, 2016, 4:17:35 PM11/2/16
to Maxent
I don't understand the predicitions from ENMeval, I write the function: plot(ENMevaluate@predictions) but I don't understand the scale of this plots, I obtain scales for example that ranging from 0.0005 to 002, and this scales and his respective proyection in the geographical space not correspond with the ocurrence data. Those rasters, really correspond to predictions in the geographical space? or are maps of standard deviation of the models?
Somebody can help me?
Thanks

Jamie M. Kass
Nov 3, 2016, 11:35:57 AM11/3/16
to Maxent
These plots are in "raw" form, not the "logistic" form you get by default from Maxent.jar. You can convert the raw predictions to logistic by using predict() on the model object (from results@models). Hope that answers your questions.
-Jamie
-Jamie
Sofia Granados
Nov 7, 2016, 12:12:08 AM11/7/16
to Maxent
Thank you, that function helped me a lot.

khura...@gmail.com
Jun 23, 2017, 11:27:05 PM6/23/17
to Maxent
Hi Jamie, Sofia!
This is something Im looking to do as well, could you provide an example of the script to convert from the raw form to logistic? An inexperienced R user here !
Thank you!
Thank you!
-Khuram
Jamie M. Kass
Jun 30, 2017, 1:44:58 AM6/30/17
to Maxent
If you want to create a logistic prediction based on the first model, if your predictor variables are a RasterStack called "envs", it looks like this:
e <- ENMevaluate(...)
e@predictions[[1]] # raw output
p <- predict(e@models[[1]], envs)
p # logistic output
Jamie
e <- ENMevaluate(...)
e@predictions[[1]] # raw output
p <- predict(e@models[[1]], envs)
p # logistic output
Jamie
khura...@gmail.com
Jun 30, 2017, 4:32:28 AM6/30/17
to Maxent
Thank you =)
-Khuram

Fabiola Rodriguez
Oct 14, 2017, 3:54:29 PM10/14/17
to Maxent
Hello,
This is very helpful, could any of you help me create the output in cumulative scale?
Thanks in advance!
Fabiola R.
Jamie M. Kass
Oct 16, 2017, 9:10:57 AM10/16/17
to Maxent
To change to output type, simply add an extra “args” parameter to predict().
Ex:
predict(model, envs, args = “outputformat=cumulative”)
Jamie
Ex:
predict(model, envs, args = “outputformat=cumulative”)
Jamie

Cuau Cabrera
Feb 7, 2018, 11:04:05 AM2/7/18
to Maxent
Hi Jamie,
Is it possible to project models to another space (extent) or time (e.g. Future climate surfaces) by using the predict function? If not, how can I do model transfers in ENMeval? Is it possible? Thank you in advance!
Cuau.
El lunes, 16 de octubre de 2017, 8:10:57 (UTC-5), Jamie M. Kass escribió:
To change to output type, simply add an extra “args” parameter to predict().
Ex: JAMIE
Jamie M. Kass
Feb 8, 2018, 3:36:20 AM2/8/18
to Maxent
Cuau,
Transferring your model to another time/place is simply a matter of substituting in a different RasterStack to predict() that has the same variable names as the stack used to train the model. If they don’t (e.g. if they are called bio1_miroc2050 and the original was bio1), just set names(r2) to names(r), if r2 is the transfer dataset and r is the one used for training.
Jamie Kass
PhD Candidate
CIty College of NY
Cuau Cabrera
Feb 15, 2018, 6:25:34 PM2/15/18
to Maxent
Thank you Jamie, it was very helpful !

Jane Anderson
May 2, 2018, 5:31:43 PM5/2/18
to Maxent
Hi Jamie,
This code worked beautifully with my data. However, the plot in the novel habitat results in a scale of 0.02-0.14, which I believe is the raw output rather than logistic. Is there a way to project the novel habitat model with a logistic output as well?
This code worked beautifully with my data. However, the plot in the novel habitat results in a scale of 0.02-0.14, which I believe is the raw output rather than logistic. Is there a way to project the novel habitat model with a logistic output as well?
Really appreciate your help!
~Jane
~Jane
Jamie M. Kass
May 2, 2018, 6:41:05 PM5/2/18
to max...@googlegroups.com
Can you post the code you’re using? The raw output should have a minimum value that is very small (close to 0), as the sum of all the cells will equal 1. That said, I think your output might be logistic. After all, logistic is default.
Jamie
--
You received this message because you are subscribed to a topic in the Google Groups "Maxent" group.
To unsubscribe from this topic, visit https://groups.google.com/d/topic/maxent/m2gTXBofi6s/unsubscribe.
To unsubscribe from this group and all its topics, send an email to maxent+un...@googlegroups.com.
To post to this group, send email to max...@googlegroups.com.
Visit this group at https://groups.google.com/group/maxent.
For more options, visit https://groups.google.com/d/optout.
-----------------------------------------------------------
Jamie M. Kass
PhD Candidate, Dept. of Biology
City College of New York, CUNY Graduate Center
Jamie M. Kass
PhD Candidate, Dept. of Biology
City College of New York, CUNY Graduate Center
Jane Anderson
May 2, 2018, 7:26:23 PM5/2/18
to Maxent
Hi Jamie,
Sure thing. The code is below. It is to project potential of Macaca fascicularis to establish in the southeastern U.S. The raw output of the native range had scale 0.0005 - 0.0025, and logistic output of native range had scale 0.2 - 0.8 Thanks again!
Mfeval1@models[[4]] #call up the model from the @results list with AICc=0
logMFeval1 = predict(Mfeval1@models[[4]],envs) #create logistic output of best model
SEUSAMFasc = list.files("C:/Users/ander/Desktop/seUSAasciis/MfascicularisAsciis",pattern='asc',
full.names=TRUE) #input list of asciis from SE USA with same names as those used in optimal M fascicularis model
SEUSAMFenvs <- raster::stack(SEUSAMFasc) #create raster stack of environmental layers from SEUSA
SEUSAMFprojection = predict(Mfeval1@models[[4]], SEUSAMFenvs) #use best model (lambdas) to project on SEUSA environmental layers
plot(SEUSAMFprojection) #plots results of model onto SEUSA
Jane Anderson
May 3, 2018, 12:43:51 AM5/3/18
to Maxent
Sorry for the dual posts, but could you also tell me if the code below is correct for the cloglog output? Thank you so much!
SEUSAMFprojection = predict(Mfeval1@models[[4]], SEUSAMFenvs, args='outputformat=cloglog')
Jamie M. Kass
May 4, 2018, 9:49:02 AM5/4/18
to max...@googlegroups.com
First, yes that is the correct code for getting the cloglog output. Second, your code is producing a logistic output, because the default is logistic. The strange values you are seeing are likely just very low suitability values for the projected extent.
JamieTo unsubscribe from this group and all its topics, send an email to maxent+unsubscribe@googlegroups.com.
To post to this group, send email to max...@googlegroups.com.
Visit this group at https://groups.google.com/group/maxent.
For more options, visit https://groups.google.com/d/optout.
Jane Anderson
May 4, 2018, 1:07:49 PM5/4/18
to Maxent
Thank you, Jamie. I really appreciate it and hope you are getting funding for all of the help you provide everyone!
Jamie M. Kass
May 4, 2018, 4:09:15 PM5/4/18
to max...@googlegroups.com
You’re welcome! Nope, nobody pays me for this, but I appreciate the gratitude :D
Jamie

cesar....@posgrado.ecologia.edu.mx
Oct 30, 2018, 11:01:37 PM10/30/18
to Maxent
Hello Jamie, I see that you have solved several doubts. I
have a problem, I ran ENMeval and I obtained models for many species
(70 species) but I made the mistake of not configuring the output
format. It seems that my rasters are in raw but the threshold to binarize is in cloglog. Since
I did it in a loop, I only saved the raster files but not @models, how
can I transform the values of each pixel from a raster to cloglog? Thank you
Jamie M. Kass
Nov 11, 2018, 7:07:56 PM11/11/18
to max...@googlegroups.com
Sorry I’m getting to this late. You can only make the transformation with the model object, as far as I know, unless you want to try manually calculating it (I wouldn’t know how). You’d do it with dismo::project().
Jamie
César Eduardo Damián Jiménez
Nov 13, 2018, 12:00:52 AM11/13/18
to max...@googlegroups.com
Thank you Jamie,
I appreciate you taking the time to respond, regards
You received this message because you are subscribed to the Google Groups "Maxent" group.
To unsubscribe from this group and stop receiving emails from it, send an email to maxent+un...@googlegroups.com.

giuseppe D'ambra
May 25, 2019, 5:55:23 PM5/25/19
to Maxent
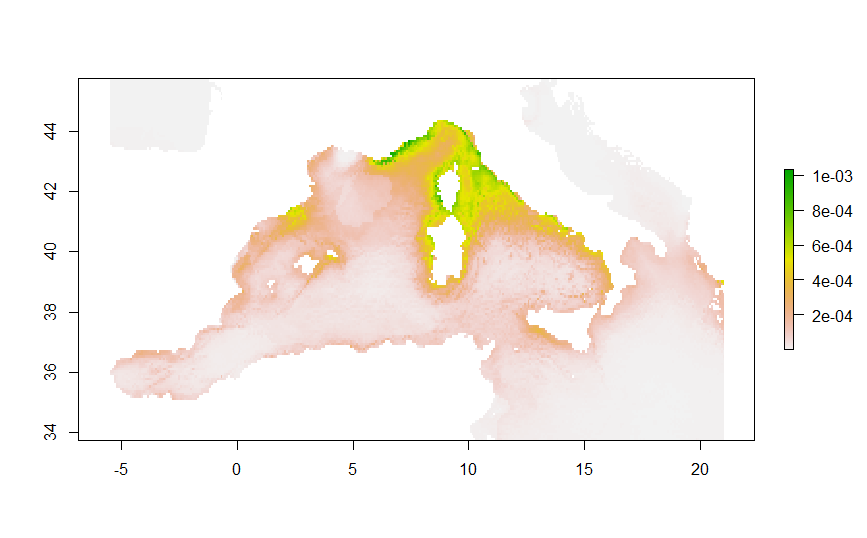
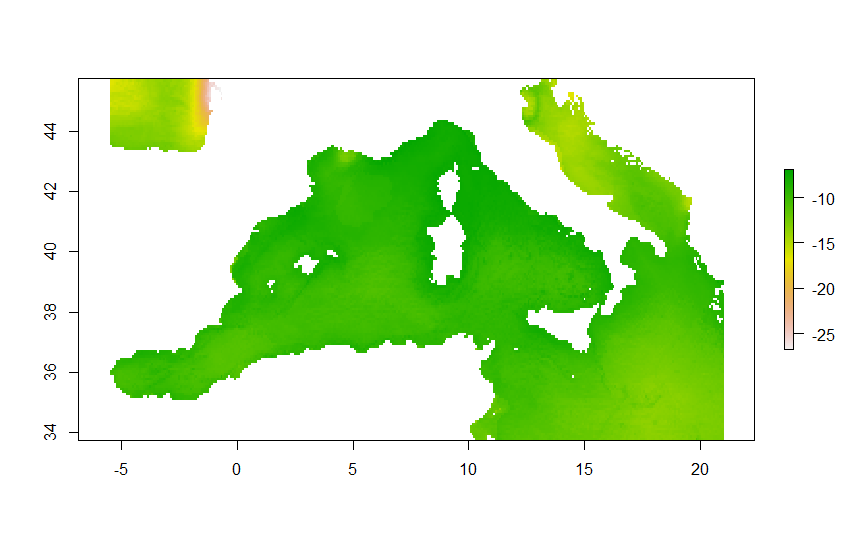
hi Jamie, i just don't understand one thing, i am working with ENMeval and Maxent 3.4.1, it's supposed that the default output(attached as first output) should be cloglog as i read in the user manual of this version. However, when i use the function predict setting args="outputformat=raw" orl ogistic, my raster is a map with almost all the location suitable, it seems very strange to me. i attached to the message the two pics, any of you have idea what i am doing wrong?
Thank you very much
To unsubscribe from this group and all its topics, send an email to max...@googlegroups.com.
To post to this group, send email to max...@googlegroups.com.
Visit this group at https://groups.google.com/group/maxent.
For more options, visit https://groups.google.com/d/optout.
Jamie M. Kass
May 25, 2019, 7:30:52 PM5/25/19
to Maxent
Giuseppe,
I assume you're using maxent.jar for your models, and not maxnet. Your first output looks like a regular "raw" map. The second is not "logistic" at all -- this should have values between 0 and 1. The fact that it has negative values is pretty confusing. Even if you misspelled it, you should get the default "cloglog", which should look very similar to "logistic". Can you provide the code you're using so we can diagnose?
Jamie Kass
JSPS Postdoctoral Researcher
Okinawa, Japan

טל רז
May 29, 2019, 1:54:03 PM5/29/19
to Maxent
Hi Jamie,
I was wondering if you can help me,
I have created models in ENMeval by using environmental predictors of Africa, but I want to predict the models to a smaller range.
When I try to use "predict" function on different rasters than the ones that were used to create the model I get this error: "Error in .local(object, ...) : missing layers (or wrong names)"
Thank you!
Tal
Message has been deleted
Jamie M. Kass
Jun 7, 2019, 7:30:38 PM6/7/19
to max...@googlegroups.com
Sorry for the late reply. Yes, you should be able to solve it by renaming the variables for the other area with the same names as the ones used to train the model. This assumes they are the same variables but just happen to have different names because they have different sources. You cannot make predictions if you are missing one or more training variables, or if you include ones not used for training.
Jamie
On Thu, May 30, 2019, 4:47 PM gafna jeff <gafn...@gmail.com> wrote:
Dear TalI am also creating models using the ENMeval package using variables in Africa. Am following the exact process as you( create models with predictor variable in Africa and then predicting to my study area in Kenya). I came across the same error and this is how I solved it. Would you mind us exchanging ideas.names(predictors of your study area) <- names( predictors that you used to create the model or predictors of Africa)
--
You received this message because you are subscribed to the Google Groups "Maxent" group.
To unsubscribe from this group and stop receiving emails from it, send an email to maxent+un...@googlegroups.com.
To post to this group, send email to max...@googlegroups.com.
Visit this group at https://groups.google.com/group/maxent.
To view this discussion on the web visit https://groups.google.com/d/msgid/maxent/6d1ec7e7-9914-4e60-b54a-de2df22bab85%40googlegroups.com.
For more options, visit https://groups.google.com/d/optout.
--
You received this message because you are subscribed to a topic in the Google Groups "Maxent" group.
To unsubscribe from this topic, visit https://groups.google.com/d/topic/maxent/m2gTXBofi6s/unsubscribe.
To unsubscribe from this group and all its topics, send an email to maxent+un...@googlegroups.com.
To post to this group, send email to max...@googlegroups.com.
Visit this group at https://groups.google.com/group/maxent.
To view this discussion on the web visit https://groups.google.com/d/msgid/maxent/CAABPRJcDcx7FLX-09NsMp4VKKVqeZ5v-uAXbj%2B1au0smk%2B41yw%40mail.gmail.com.

gafna jeff
Jun 17, 2019, 9:14:57 AM6/17/19
to max...@googlegroups.com
Dear Jamie,
I have downloaded the climate change scenario and stacked it with my bioclim variables. However, I am confused regarding the variables that I should use when predicting climate change scenario. For instance, when I call the names of what I have stacked, I do not know whether to use the variables with point 1 (ie "bio12.1") or those with point 2 (ie "bio12.2"). See the results when I call the names at the lower end. I believe my procedure is right but I stand to be corrected
Assuming my predictors the predictors that I used to fit the original model are:
predictors <- bioclim_africa[[c("bio12", "bio16", "bio7", "bio2", "bio8")]]
#read climate change scenario
cc_85 <- getData('CMIP5', var="bio", res=2.5, rcp=85, model='HD', year=70, download=F, path="./data")
cc_85 <- crop(cc_85, africa)
cc_85 <- mask(cc_85, africa)
##
cc2<- resample(bioclim_africa, cc_85, method="bilinear")
cc2 <- crop(bioclim_africa, cc2)
cc2 <- mask(bioclim_africa, cc2)
extent(bioclim_africa)
extent(cc2)
#stack cc and bioclim data only for africa
bioclim_cc_85_africa <- stack(bioclim_africa, cc2)
cc_85 <- mask(cc_85, africa)
##
cc2<- resample(bioclim_africa, cc_85, method="bilinear")
cc2 <- crop(bioclim_africa, cc2)
cc2 <- mask(bioclim_africa, cc2)
extent(bioclim_africa)
extent(cc2)
#stack cc and bioclim data only for africa
bioclim_cc_85_africa <- stack(bioclim_africa, cc2)
names(bioclim_cc_85_africa)
[1] "bio1.1" "bio2.1" "bio3.1" "bio4.1" "bio5.1" "bio6.1" "bio7.1" "bio8.1" "bio9.1" "bio10.1" "bio11.1"
[12] "bio12.1" "bio13.1" "bio14.1" "bio15.1" "bio16.1" "bio17.1" "bio18.1" "bio19.1" "bio1.2" "bio2.2" "bio3.2"
[23] "bio4.2" "bio5.2" "bio6.2" "bio7.2" "bio8.2" "bio9.2" "bio10.2" "bio11.2" "bio12.2" "bio13.2" "bio14.2"
[34] "bio15.2" "bio16.2" "bio17.2" "bio18.2" "bio19.2"
Dikko
To view this discussion on the web visit https://groups.google.com/d/msgid/maxent/CAC7RpfpvexGG%3Dn%2BP5D7c4Zih7S8RAcZNYxDGkVS1NhEy7BK4oQ%40mail.gmail.com.
Reply all
Reply to author
Forward
0 new messages