Funny results :D
42 views
Skip to first unread message

Dayanara Jacome
May 17, 2018, 3:52:31 PM5/17/18
to max...@googlegroups.com
Hi everyone!!!! :D
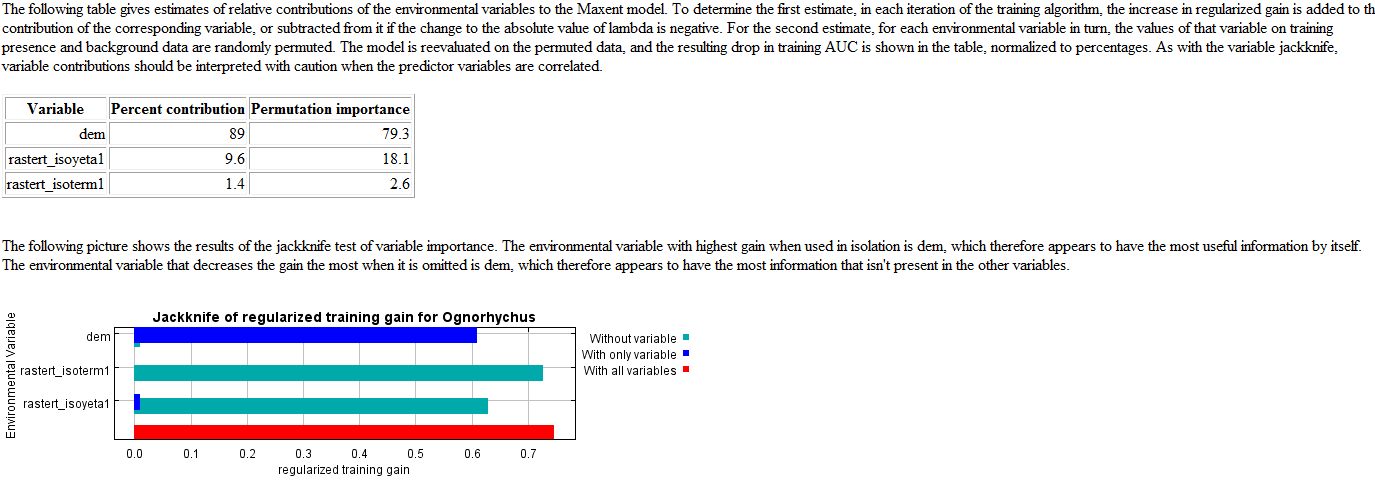
Now I have another problem... it seems to be a problem with my enviromental information. I used topology, temperature and precipitation. And when it run, the result was that MaxEnt gives a high importance to topology (80%), precipitation (18%) and temperature (2%). I used the srtm 30 m DEM, and temperature and precipitaion are information from a meteorological institude here in my country.
Now I have another problem... it seems to be a problem with my enviromental information. I used topology, temperature and precipitation. And when it run, the result was that MaxEnt gives a high importance to topology (80%), precipitation (18%) and temperature (2%). I used the srtm 30 m DEM, and temperature and precipitaion are information from a meteorological institude here in my country.
I am not working with bioclim because of scale problem.

Heiko
May 18, 2018, 7:15:43 AM5/18/18
to Maxent
What exactly is your question?
You expect topology, precipitation and temperature to be enough to explain your species' (whatever it is you are looking at) distribution?
You expect topology, precipitation and temperature to be enough to explain your species' (whatever it is you are looking at) distribution?
Dayanara Jacome
May 18, 2018, 8:59:16 AM5/18/18
to max...@googlegroups.com
I want to know if there is any way to be sure and to have confidence in the modeling ... It seems strange to me to have that importance in topology ... The model map does not seem so funny, in fact it is quite accurate. distribution, but it is the percentage of
environmental variables that I need to be sure of. :(

Thank you for your answer :)
--
You received this message because you are subscribed to the Google Groups "Maxent" group.
To unsubscribe from this group and stop receiving emails from it, send an email to maxent+unsubscribe@googlegroups.com.
To post to this group, send email to max...@googlegroups.com.
Visit this group at https://groups.google.com/group/maxent.
For more options, visit https://groups.google.com/d/optout.

Husam El Alqamy
May 18, 2018, 1:11:43 PM5/18/18
to max...@googlegroups.com
what about your jackknife results? do they conform to these results?
| Hossameldin ELALKAMY, MPhill., PhD. GIS Analyst Conservation Data Center| Victoria Ministry of Environment & Climate Change P. 250.614.7521 C. 778.896.3229|395 Waterfront Cres. Victoria, BC., V8W 9M1 |
| Profile |

Dayanara Jacome
May 18, 2018, 2:26:43 PM5/18/18
to max...@googlegroups.com
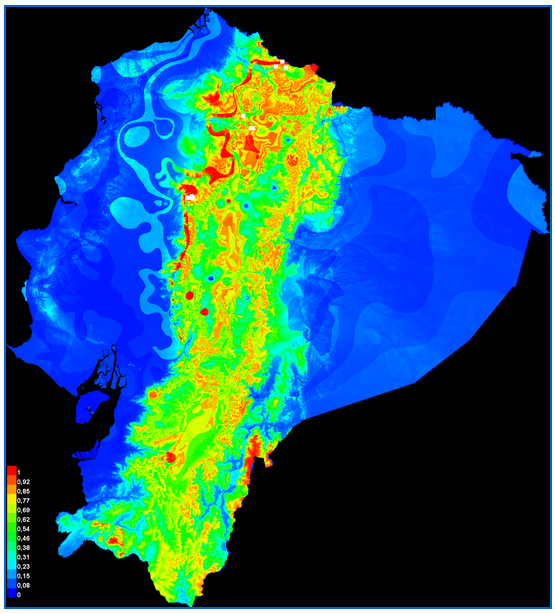
I am going to show you the results, so you can see it. The bird is supossed to be in the central region of Ecuador, but only in the north part. As far as I know the distribution of the bird, I can tell the model map is pretty good, but I dont think giving an extreme importance of topology is right.
Husam El Alqamy
May 18, 2018, 2:39:46 PM5/18/18
to max...@googlegroups.com
I think that you have a very low number of environmental predictors. from the Jackknife, it seems that only the info coming from the topology(dem) is the one driving the model while the other two are very trivial to explain the variation in your training data. My advice is to revisit the ecology of the species you are working with and try to findout what other possible factors could drive the distribution and try to find data layers that represent these new factors. I would suggest factors such as vegetation, land cover, proximity to road or urban centers. Good luck.
| Hossameldin ELALKAMY, MPhill., PhD. GIS Analyst Conservation Data Center| Victoria Ministry of Environment & Climate Change P. 250.614.7521 C. 778.896.3229|395 Waterfront Cres. Victoria, BC., V8W 9M1 |
| Profile |

Husam El Alqamy
May 18, 2018, 2:41:17 PM5/18/18
to max...@googlegroups.com
another thing, can you set the threshold in Maxent to Minimum Training value and see how your binary distributon map look like.
| Hossameldin ELALKAMY, MPhill., PhD. GIS Analyst Conservation Data Center| Victoria Ministry of Environment & Climate Change P. 250.614.7521 C. 778.896.3229|395 Waterfront Cres. Victoria, BC., V8W 9M1 |
| Profile |

Reply all
Reply to author
Forward
0 new messages