txt2las - return numbers
71 views
Skip to first unread message

Guilherme Braghirolli
Jul 31, 2016, 1:41:28 PM7/31/16
to LAStools - efficient tools for LiDAR processing
Hello guys, hope someone can help with a small problem..
I just transformed my LiDAR data from the ascii files I had available, to LAS.
In order to stardardize the data, I developed a Model Builder inside ArcMap. Below is shown the structure of the input file, and also the output.
Input .txt file (txyzixyzi)
238641.507250 625303.712 6756854.690 1.681 32
238641.507270 625303.214 6756853.975 1.685 17
238641.507290 625302.832 6756853.413 1.697 33
238641.507310 625302.442 6756852.837 1.725 23
238641.507330 625302.049 6756852.266 1.702 35 625302.046 6756852.272 1.650 35
238641.507350 625301.645 6756851.691 1.731 38 625301.656 6756851.696 1.679 38
238641.507370 625301.148 6756850.964 1.652 47 625301.155 6756850.960 1.645 47
238641.507390 625300.771 6756850.401 1.745 79 625300.768 6756850.398 1.698 79
Output .txt file (txyzirn)
238641.507250 625303.712 6756854.690 1.681 32 1 1
238641.507270 625303.214 6756853.975 1.685 17 1 1
238641.507290 625302.832 6756853.413 1.697 33 1 1
238641.507310 625302.442 6756852.837 1.725 23 1 1
238641.507330 625302.049 6756852.266 1.702 35 1 2
238641.507330 625302.046 6756852.272 1.650 35 2 2
238641.507350 625301.645 6756851.691 1.731 38 1 2
238641.507350 625301.656 6756851.696 1.679 38 2 2
238641.507370 625301.148 6756850.964 1.652 47 1 2
238641.507370 625301.155 6756850.960 1.645 47 2 2
238641.507390 625300.771 6756850.401 1.745 79 1 2
238641.507390 625300.768 6756850.398 1.698 79 2 2
Where:
t - the gps time/ x - x coordinate/ y - y coordinate/ z - z coordinate/ i - intensity/r - number of this return/ n - number of returns for given pulse
The output .txt file was used to create the LAS file (txt2las toolbox, inside ArcMap).
As you can see, in the Input file, both returns were in the same line and not all of the pulses had both returns. I assumed that the first return corresponds to the first xyz coordinates.
So, analyzing my data I created a profile graph of a small vegetation block classified by return number, where first return is blue and second return is red.
Given that information, I'd like someone's opinion on the results I had.
It appears to me that the return numbers are inverted considering that most of the ground information is being filled with first returns, and trees are mostly represented by second returns.
As I don't have much experience using Lidar data, I'm not sure if this result can be considered wrong, or if my basic concepts on return numbers are inverted :).
Thanks, and hope to hear from you soon.

Kirk Waters - NOAA Federal
Aug 1, 2016, 10:53:26 AM8/1/16
to LAStools - efficient command line tools for LIDAR processing
Guilherme,
While your plot certainly suggests that the returns are flipped, your example input data doesn't support that. That data shows the second return on the line has a lower elevation than the first one. Looking at the plot, I'd guess you have more red dots than blue dots (but I obviously can't really tell), which suggests the red dots are your first returns. Any chance you mis-colored them? I've seen other input data in a format like this and the first return has always been the first one on the line, just as you expected.
Regards,
Kirk
--
Kirk Waters, PhD | NOAA Office for Coastal Management
Applied Sciences Program | 2234 South Hobson Ave
843-740-1227 | Charleston, SC 29405
843-740-1227 | Charleston, SC 29405
--
Download LAStools at
http://lastools.org
http://rapidlasso.com
Be social with LAStools at
http://facebook.com/LAStools
http://twitter.com/LAStools
http://linkedin.com/groups/LAStools-4408378
Manage your settings at
http://groups.google.com/group/lastools/subscribe
Guilherme Braghirolli
Aug 2, 2016, 7:30:28 AM8/2/16
to last...@googlegroups.com
Thanks Kirk,
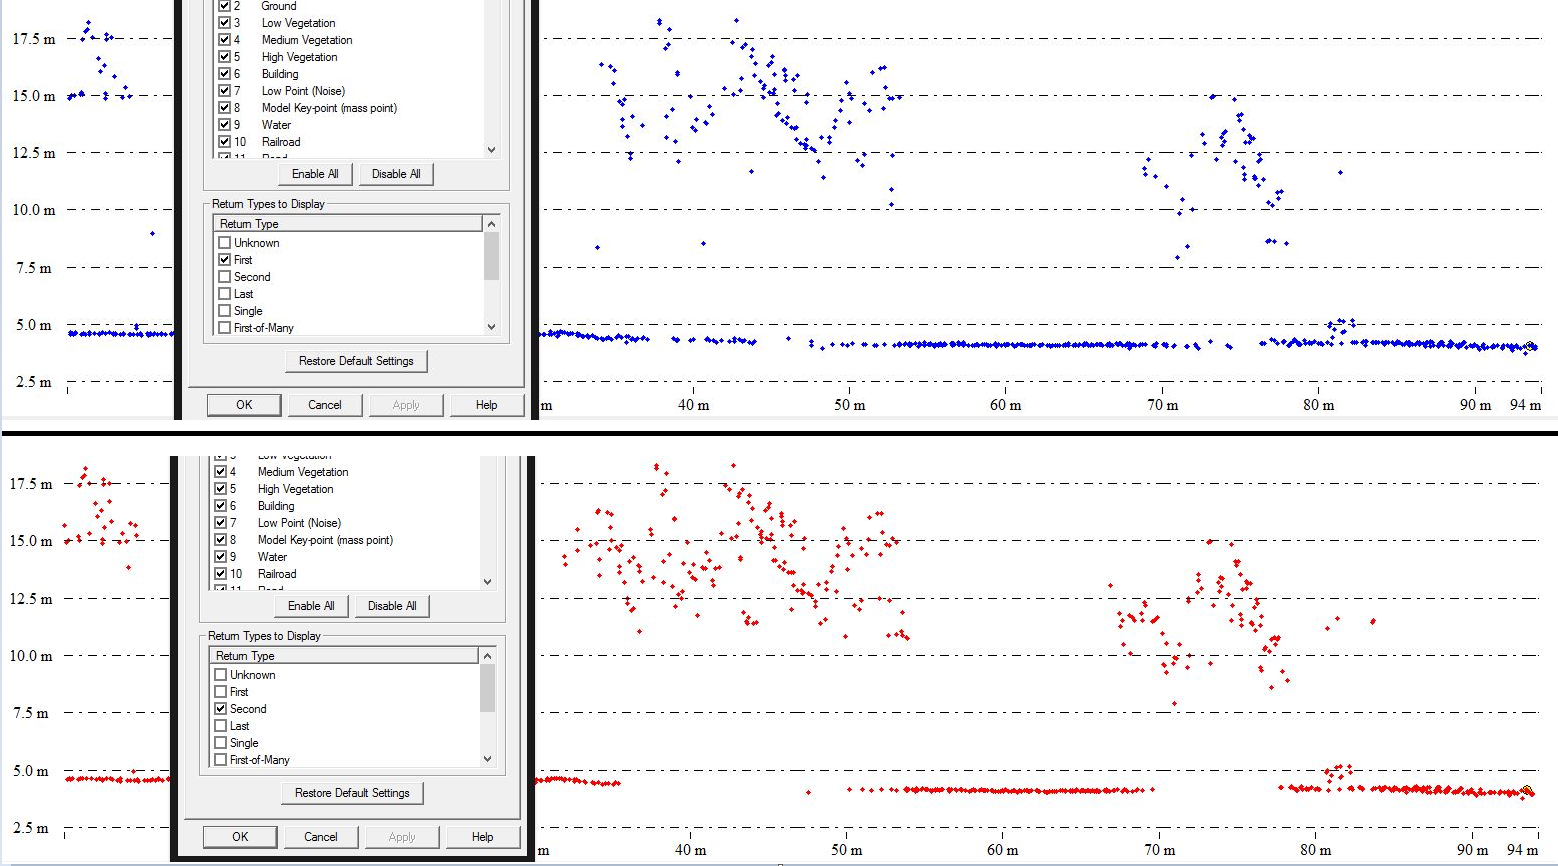
I double-checked the coloring, and even filtered it using other software..still same result - as you can see below.
Do you know if there's any tool or script I can use to flip the returns back, straight from the LAS file?
Best regards,
Guilherme Braghirolli
Mestrando PPGPlan - UDESC
Engenheiro Florestal e Técnico Agrimensor
CREA/SC: 123359-0
+55 048 9681-1260

Martin Isenburg
Aug 5, 2016, 1:55:28 AM8/5/16
to LAStools - efficient command line tools for LIDAR processing
Hello,
i think we have two issues here. One is an error of extraction of multi-returns. This could be a serious issue. Might be a poor waveform decomposition algorithm that detects too many peaks? The other one is less dramatic: A simple flip in the return numbering that can be fixed easily. Let's first look at the serious issue that I first noticed in your text output and - on closer inspection - also seems visible in the pair of images you send in the last email.
238641.507330 625302.049 6756852.266 1.702 35 1 2
238641.507330 625302.046 6756852.272 1.650 35 2 2
5.2cm
238641.507350 625301.645 6756851.691 1.731 38 1 2
238641.507350 625301.656 6756851.696 1.679 38 2 2
5.2cm
238641.507370 625301.148 6756850.964 1.652 47 1 2
238641.507370 625301.155 6756850.960 1.645 47 2 2
0.7cm
238641.507390 625300.771 6756850.401 1.745 79 1 2
238641.507390 625300.768 6756850.398 1.698 79 2 2
4.7cm
The z difference between these first and second returns is around 1 cm to 5cm. This makes no sense. There should at least (even in the best possible case) be a distance of 20 cm between two returns with 50cm to 100cm being more believable. See this discussion thread here:
I think what you are seeing here may be the representation of a *wider than usual* peak in the retuning waveform that is maybe coded via two locations that represent the geometric range of the beginning to the end of the stretched-out returning peak in laser energy. The fact that both *returns* are only given a single and identical intensity further cements this hypothesis.
You can use the tool "lasreturn" to generate a histogram of the distances between subsequent returns.
Here is how a "typical" histogram of distances between subsequent returns looks like in the range between 0 and 100 cm.
D:\LAStools\bin>lasreturn -i ..\data\fusa.laz -histo return_distance 0.05 0 0.99
processed returns of '..\data\fusa.laz'
return distances [meter] histogram with bin size 0.05
bin [0.2,0.25) has 1
bin [0.25,0.3) has 1
bin [0.3,0.35) has 3
bin [0.35,0.4) has 2
bin [0.4,0.45) has 4
bin [0.45,0.5) has 8
bin [0.5,0.55) has 12
bin [0.55,0.6) has 18
bin [0.6,0.65) has 20
bin [0.65,0.7) has 31
bin [0.7,0.75) has 31
bin [0.75,0.8) has 72
bin [0.8,0.85) has 90
bin [0.85,0.9) has 99
bin [0.9,0.95) has 102
bin [0.95,1) has 13652
average return distances [meter] 0.983015 for 14146 element(s)
checked returns of 13865 multi and 249562 single return pulses. took 0.109 secs
Here is how a "strange" histogram of distances between subsequent returns looks like in the range between 0 and 100 cm.
D:\LAStools\bin>lasreturn -i ..\data\zurich.laz -histo return_distance 0.05 0 0.99
processed returns of '..\data\zurich.laz'
return distances [meter] histogram with bin size 0.05
bin [0,0.05) has 16
bin [0.05,0.1) has 16
bin [0.1,0.15) has 30
bin [0.15,0.2) has 35
bin [0.2,0.25) has 43
bin [0.25,0.3) has 65
bin [0.3,0.35) has 87
bin [0.35,0.4) has 177
bin [0.4,0.45) has 207
bin [0.45,0.5) has 389
bin [0.5,0.55) has 562
bin [0.55,0.6) has 856
bin [0.6,0.65) has 1308
bin [0.65,0.7) has 2155
bin [0.7,0.75) has 2757
bin [0.75,0.8) has 3278
bin [0.8,0.85) has 3458
bin [0.85,0.9) has 3730
bin [0.9,0.95) has 3638
bin [0.95,1) has 165480
average return distances [meter] 0.962687 for 188287 element(s)
checked returns of 106924 multi and 361626 single return pulses. took 0.312 secs
Guilherme Braghirolli
Aug 7, 2016, 2:26:32 AM8/7/16
to last...@googlegroups.com
Hello Martin, it was really helpful, considering I've never seen a typical lidar data yet, not with multiple returns.
I attached the full results I had from "lasreturn" tool (lassorted the input). Considering both your examples, I have really weird results. I generated a full report without the limitation "0.05 0 0.99" that you showed, so its a bit longer.
About the inverted return numbers I have, could you give me hint on how can I flip them?
Thanks for your help.
Guilherme Braghirolli
Mestrando PPGPlan - UDESC
Engenheiro Florestal e Técnico Agrimensor
CREA/SC: 123359-0
+55 048 9681-1260
Martin Isenburg
Aug 7, 2016, 2:48:39 AM8/7/16
to LAStools - efficient command line tools for LIDAR processing
Hello,
looks like the *vast* majority of the double-returns in your data set are practically in the same place. There are 13,125 pulses with a single return and 3,274,549 pulses with two returns. Of those 3,225,532 (or 98.5 %) are less than 10 cm apart (and should probably also be turned into a single return instead). Where does this data set come from???
Not sure it is worthwhile for this data ... but you can change the two as follows:
D:\LAStools\bin>las2txt -i ..\data\fusa.laz ^
-parse txyzirn ^
-stdout | ^
las2txt -stdin -itxt ^
-parse txyzinr ^
-o fusa_switched_r_n.laz
See ... now the file is no longer specification conform:
D:\LAStools\bin>lasvalidate -i fusa_switched_r_n.laz -no_CRS_fail
This is version 160512 of the LAS validator. Please contact
me at 'martin....@rapidlasso.com' if you disagree with
validation reports, want additional checks, or find bugs as
the software is still under development. Your feedback will
help to finish it sooner.
needed 0.10 sec for 'fusa_switched_r_n.laz' fail
D:\LAStools\bin>more validate.xml
<?xml version="1.0" encoding="UTF-8"?>
<LASvalidator>
<report>
<file>
<name>fusa_switched_r_n.laz</name>
<path>fusa_switched_r_n.laz</path>
<version>1.2</version>
<system_identifier>LAStools (c) by rapidlasso GmbH</system_identifier>
<generating_software>txt2las (version 160804)</generating_software>
<point_data_format>0</point_data_format>
<CRS>not valid or not specified</CRS>
</file>
<summary>
fail
</summary>
<details>
<fail>
<variable>return number</variable>
<note>there are 13636 points with a larger return number (2) than their number of returns of given pulse (1)</note>
</fail>
<fail>
<variable>return number</variable>
<note>there are 284 points with a larger return number (3) than their number of returns of given pulse (1)</note>
</fail>
<fail>
<variable>return number</variable>
<note>there are 283 points with a larger return number (3) than their number of returns of given pulse (2)</note>
</fail>
<warning>
<variable>scan angle rank</variable>
<note>scan angle rank of all 277573 points is 0</note>
</warning>
<warning>
<variable>point source ID</variable>
<note>file source ID in header and point source ID of all 277573 points is 0</note>
</warning>
<warning>
<variable>CRS</variable>
<note>file does not specify a Coordinate Reference System with GEOTIFF tags</note>
</warning>
</details>
</report>
<total>
fail
<details>
<pass>0</pass>
<warning>0</warning>
<fail>1</fail>
</details>
</total>
<version>
160512 built with LASread version 1.0 (160119)
</version>
<command_line>
lasvalidate -i fusa_switched_r_n.laz -no_CRS_fail
</command_line>
</LASvalidator>

Evon Silvia
Aug 16, 2016, 2:02:27 AM8/16/16
to last...@googlegroups.com
Martin,
They never specified which sensor this data is from, but if this data was produced by Leica's software, I've seen these return-duplicates during data extraction when the user chooses to export all raw Gain and Non-Gain points for ALS70/80 sensors. It's a long story, but in short these sensors will often record nearly the same point (±0-5cm) in both channels, and normally it will "auto-select" which point to retain based on intensity. However, the user has control over whether this happens. In CloudPro, this setting is under Edit > Calibration Parameters > Select Multi Channel Options.
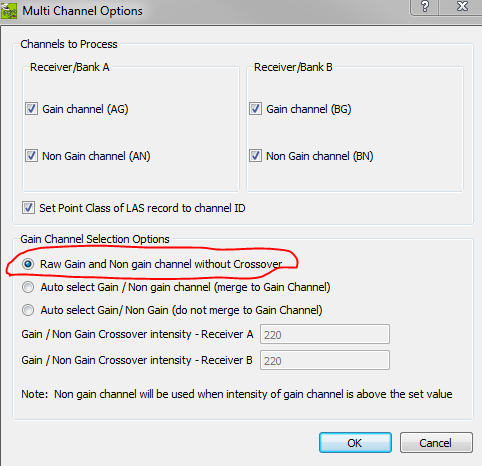
For other sensors, this could be from any number of sources.
Evon
--
 |
Evon Silvia PLS
Solutions Developer 517 SW 2nd Street, Suite 400, Corvallis, OR 97333 P: (541) 452-8502 |
On Sat, Aug 6, 2016 at 11:44 PM, Martin Isenburg <martin....@gmail.com> wrote:
Hello,looks like the *vast* majority of the double-returns in your data set are practically in the same place. There are 13,125 pulses with a single return and 3,274,549 pulses with two returns. Of those 3,225,532 (or 98.5 %) are less than 10 cm apart (and should probably also be turned into a single return instead). Where does this data set come from???Not sure it is worthwhile for this data ... but you can change the two as follows:D:\LAStools\bin>las2txt -i ..\data\fusa.laz ^-parse txyzirn ^-stdout | ^las2txt -stdin -itxt ^-parse txyzinr ^-o fusa_switched_r_n.lazSee ... now the file is no longer specification conform:
D:\LAStools\bin>lasvalidate -i fusa_switched_r_n.laz -no_CRS_failThis is version 160512 of the LAS validator. Please contact
me at 'martin.isenburg@rapidlasso.com' if you disagree with
Reply all
Reply to author
Forward
0 new messages