Computing canopy metrics on many shapefiles with csv output
260 views
Skip to first unread message

Peter Davis
Oct 23, 2016, 8:19:44 PM10/23/16
to LAStools - efficient tools for LiDAR processing
Hi,
I have 4 separate shapefiles that each contain between 110 and 1700 polygons that were generated using a segmentation classification. For each polygon within the shapefiles, I need to compute the average, min, max, and standard deviation of canopy height, as well as the 3 canopy cover metrics. I would like these outputted as a csv with each row numbered like the polygons, 1-110 for example.
So ideally my output for the first shapefile containing 110 polygons would be a csv with 110 rows and 6 columns (average, min, max, std, cov, dns, and gap)
In order to iterate through all of the polygons I am using -lop polygons.shp
The data was delivered as tiled, with classification as follows:
1- default/unclassified - laser returns not included in ground class, composed of vegetation and man-made structures
2- ground
6- anthropogenic - permanent man made features
7- noise
I was unsuccessful in running this on the tiles, so I used lasmerge to create one file.
I was able to run lasclassify on this single file, but it resulted in a ton of warnings, several for each polygon, like this: WARNING: polygon 2 > has duplicate point at count 137
Why am I getting these warnings, and will they affect my results?
As far as the output, there are more rows in the csv than there are polygons in the shape file. what would account for this?
Also, all of the canopy cover metrics are 0. Is this because of the classification style? Is it possible to reclassify already classified data? There are no buffers on the tiles
Thanks very much for all the help,
Pete

Martin Isenburg
Oct 23, 2016, 9:26:32 PM10/23/16
to LAStools - efficient command line tools for LIDAR processing
Hello Pete,
On Sun, Oct 23, 2016 at 11:39 PM, Peter Davis <peteda...@gmail.com> wrote:
Hi,I have 4 separate shapefiles that each contain between 110 and 1700 polygons that were generated using a segmentation classification. For each polygon within the shapefiles, I need to compute the average, min, max, and standard deviation of canopy height, as well as the 3 canopy cover metrics. I would like these outputted as a csv with each row numbered like the polygons, 1-110 for example.So ideally my output for the first shapefile containing 110 polygons would be a csv with 110 rows and 6 columns (average, min, max, std, cov, dns, and gap)In order to iterate through all of the polygons I am using -lop polygons.shpThe data was delivered as tiled, with classification as follows:1- default/unclassified - laser returns not included in ground class, composed of vegetation and man-made structures2- ground6- anthropogenic - permanent man made features7- noiseI was unsuccessful in running this on the tiles, so I used lasmerge to create one file.
There should be no difference between
lascanopy -i input/*.laz -merged ^
-lop polygons.shp ^
-avg -min -max -std -cov -dns -gap ^
-o results.cvs
and
lascanopy -i merged.laz ^
-lop polygons.shp ^
-avg -min -max -std -cov -dns -gap ^
-o results.cvs
Except that the first might be faster. Note that this computes 5 (not 6) metrics as the '-gap' only tells '-cov' and '-dns' to report 100% minus COV or minus DNS as output. It seems most people that use this option want the canopy gap *fraction* which is obtained by also adding '-fraction'. By default your cutoffs will be 1.37 for both the height metrics and the cover metrics (-> so '-min' is likely to be around 1.37 in most plots containing vegetation).
I was able to run lasclassify on this single file, but it resulted in a ton of warnings, several for each polygon, like this: WARNING: polygon 2 > has duplicate point at count 137Why am I getting these warnings, and will they affect my results?
You should inspect your polygons. Either they have repeated vertices or they are funnily shaped (e.g. bow ties) or their last segment is repeated. Either should not affect your results but a sanity check never hurts.
As far as the output, there are more rows in the csv than there are polygons in the shape file. what would account for this?
Currently LAStools does not read the DBF file. So if you have "soft-deleted" polygons in your SHP file (i.e. polygons that are marked deleted in the DBF file) then they will still be considered by lascanopy. Not sure how to properly "hard-delete" polygons from your SHP file but maybe a simple "save as ..." in your favorite GIS package will work?
Also, all of the canopy cover metrics are 0. Is this because of the classification style? Is it possible to reclassify already classified data?
No, lascanopy does not make use of the classification codes of the LAS / LAZ files (unless you explicitly add a "filter by classification" to the command line). But as the README file states, the canopy cover metric is counting first returns above the canopy cover cutoff and divides them by all first returns.
I assume your files do not have first returns properly marked as such? Had you included a lasinfo report to at least one of your input files I could have checked whether that is indeed the case ... but you can do it easily on your end.
Regards,
Martin @rapidlasso
Peter Davis
Oct 24, 2016, 8:25:42 PM10/24/16
to LAStools - efficient tools for LiDAR processing
Thanks Martin. With your help I was able to sort out all but the extra polygon problem. I've tried saving the polygons in a number of ways in Arc to get rid of these "soft-deleted" polygons, but haven't been successful. If anyone has a workaround for this problem please let me know.
Thanks for the help,
Pete

lars.f...@gmail.com
Oct 25, 2016, 4:48:45 AM10/25/16
to last...@googlegroups.com
Hi!
Try to export your polygon shapefiles in another format (I understand you use Arcmap - try to export to coverage - if that is available these days in Arcmap) and then import / convert them to new shapefiles.--
Download LAStools at
http://lastools.org
http://rapidlasso.com
Be social with LAStools at
http://facebook.com/LAStools
http://twitter.com/LAStools
http://linkedin.com/groups/LAStools-4408378
Manage your settings at
http://groups.google.com/group/lastools/subscribe
--
------------------
Lars Forseth
Arkeolog
97528143
------------------
Lars Forseth
Arkeolog
97528143
------------------
Peter Davis
Oct 25, 2016, 8:38:01 PM10/25/16
to LAStools - efficient tools for LiDAR processing
Thanks for your help.. I tried this method, but was unsuccessful. I then exported all the selected polygons to individual shapefiles, imported each back to ArcMap individually and merged to create a new shapefile. I tried lascanopy on this new shapefile, and got the same results -5 extra results (115 to the 110 polygons).
So I decided to try the same method on a fewer amount of polygons. I selected a subset of 10 random polygons out of the 110 original, created a new shapefile, and ran the same command. This was successful, and in fact generated 10 results. Very confusing... I guess I'll try cutting the 110 in half, and then running the process on each. If that works, it will be very stressful when I have to run on the 1600 polygon set.
Any more input would be much appreciated!
cmd im using:
lascanopy -lof file_list.1396.txt -merged -lop "c:\...." -files_are_plots -cov -dns -gap -max -avg -std -odir "c:\polygons_120" -ocsv
Thanks very much,
Pete
On Sunday, October 23, 2016 at 6:19:44 PM UTC-6, Peter Davis wrote:

Antonio Ruiz
Oct 26, 2016, 5:06:13 AM10/26/16
to last...@googlegroups.com
Pete,
It is possible that the extra polygons you have appear after building the topology. As shapefiles, the canopy polygons don't need to have topology, but when you build topology in ArcMap, new polygons are created that fill the working area. One of the polygons in fact is the boundary of the working area, it is the largest area polygon. One possible solution would be adding a column to mark the canopy polygons as canopy before building the topology.
Hope this helps,
Toni
--
Peter Davis
Oct 26, 2016, 8:36:39 PM10/26/16
to LAStools - efficient tools for LiDAR processing
Thanks Antonio,
I'm not sure what you mean by building the topography. By merging the polygons into one shapefile? It does make sense how these other polygons would be created, as you have described, but I'm not sure how to fix it. I'm fairly new to these functions, so my skills may not be up to that level
Martin and others,
Is it possible for LasCanopy to iterate through individual polygon shapefiles that I have in a folder, rather than a shapefile containing all the polygons, and compute these metrics, and output in a CSV while retaining the order?
Thanks
On Sunday, October 23, 2016 at 6:19:44 PM UTC-6, Peter Davis wrote:
Antonio Ruiz
Oct 27, 2016, 4:50:08 AM10/27/16
to last...@googlegroups.com
Peter,
Regards
--
Martin Isenburg
Nov 14, 2016, 6:03:03 PM11/14/16
to LAStools - efficient command line tools for LIDAR processing
Hello,
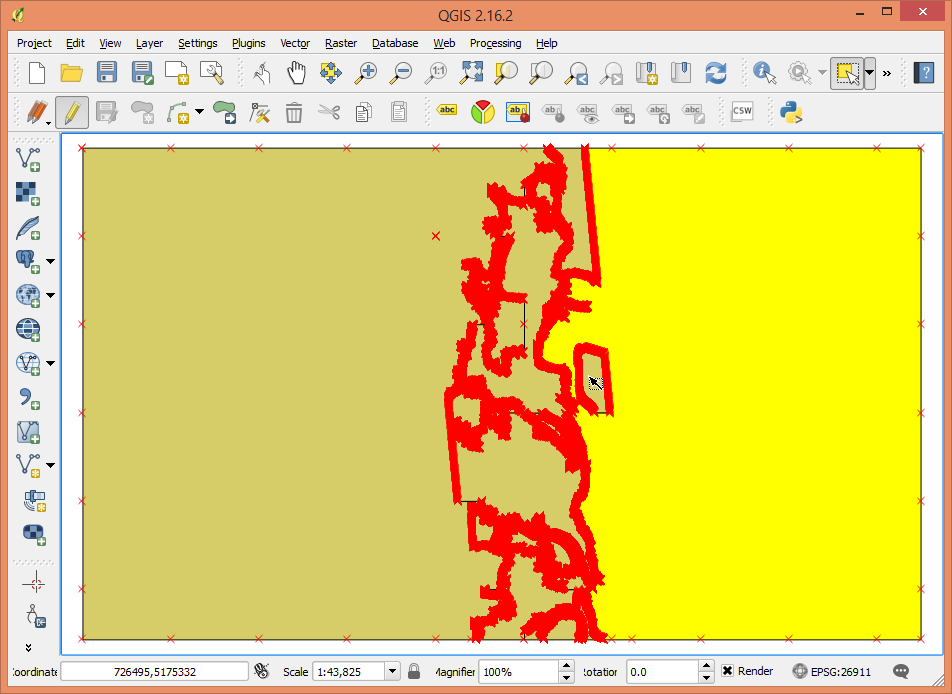
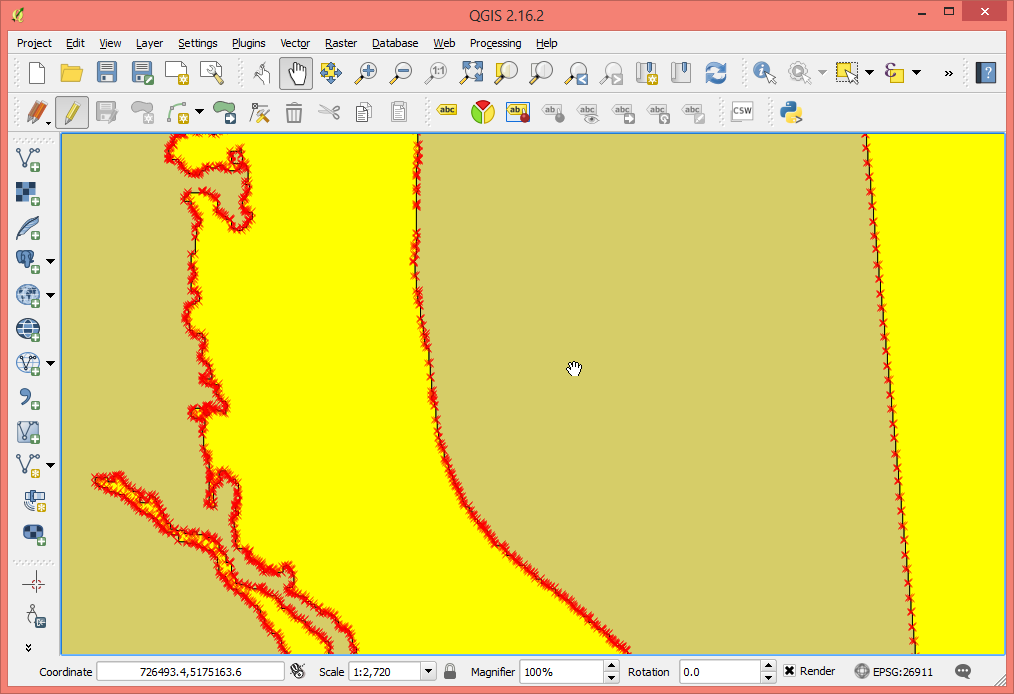
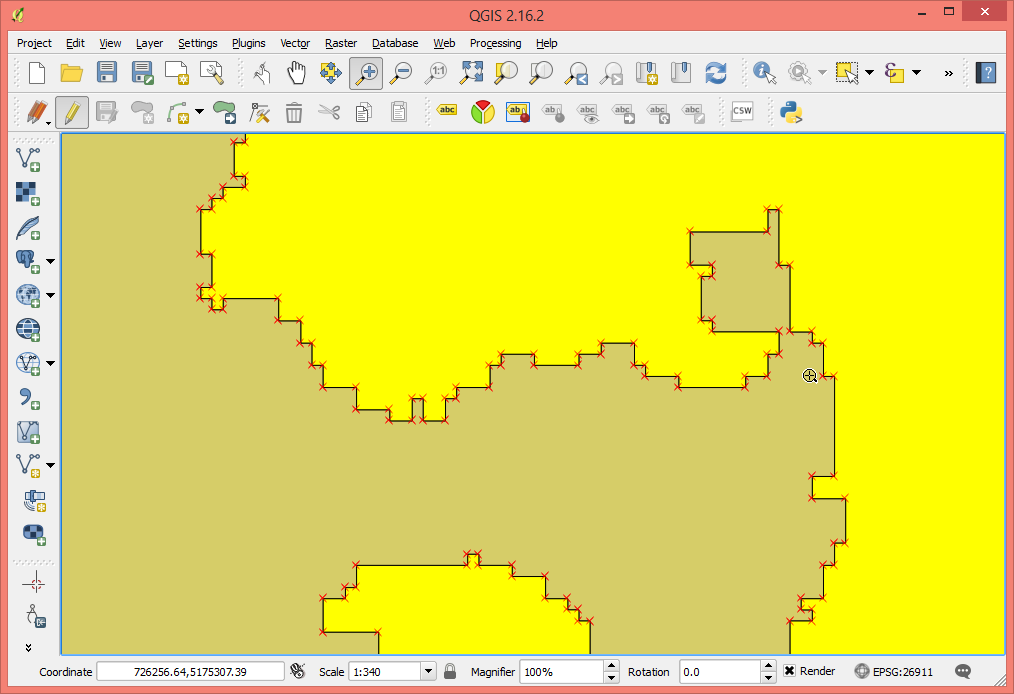
the issue was solved (or rather it can be explained now). Peter's SHP file had some rather complex plots (or rather stands). Some of those plots / stands in Peter's SHP file had holes (aka there were some "donut-shaped" plots or stands) and these holes in the polygon were read as additional plot polygons instead of being cut out from whichever plot they were in. While holes or donuts are still not supported by lascanopy, this is now easier to debug as I have added a '-very_verbose' or '-vv' option to lascanopy that reports the area the polygons in the SHP file and if their area is negative then they are a hole and not a plot.
Attached some screen shots to give you an idea about the complexity of Peter's SHP file (this is his smallest example) and you can see one of the 14 polygons that has a big hole as well as the complex geometry of the polygon in the zoomed in views. In total there are 14 polygons and 3 holes polygons that lascanopy reads as 17 plot polygons.
lascanopy -vv -i E:\LAStools\bin\too_many\*.laz ^
-merged ^
-lop "full_plots.shp" ^
-cov -dns -min -max -std -fractions ^
-o full_plots.csv
found 17 polygons in file 'full_plots.shp'
polygon 0 has 5 vertices with bounding box [724721.9432/724722.9432] to [5176950.266/5176951.266] and area 1
polygon 1 has 3943 vertices with bounding box [725800.9432/726273.9432] to [5176950.266/5177761.266] and area 136639
polygon 2 has 801 vertices with bounding box [726360.9432/726744.9432] to [5174902.266/5175662.266] and area 219847
polygon 3 has 2569 vertices with bounding box [725748.9432/726365.9432] to [5174245.266/5174902.266] and area 105364
polygon 4 has 2531 vertices with bounding box [725133.9432/725566.9432] to [5173272.266/5173878.266] and area 135887
polygon 5 has 1023 vertices with bounding box [725922.9432/726448.9432] to [5172272.266/5172562.266] and area 112722
polygon 6 has 9064 vertices with bounding box [725059.9432/725746.9432] to [5175360.266/5176950.266] and area 397680
polygon 7 has 7680 vertices with bounding box [724863.9432/725720.9432] to [5174493.266/5175288.266] and area 285442
polygon 8 has 22908 vertices with bounding box [720626.9432/726361.9432] to [5172272.266/5177974.266] and area 26793374
polygon 9 has 5 vertices with bounding box [724721.9432/724722.9432] to [5176950.266/5176951.266] and area -1
polygon 10 has 5277 vertices with bounding box [725984.9432/726599.9432] to [5175926.266/5177974.266] and area 574342
polygon 11 has 26790 vertices with bounding box [724905.9432/726635.9432] to [5172908.266/5177593.266] and area 3424603
polygon 12 has 2569 vertices with bounding box [725748.9432/726365.9432] to [5174245.266/5174902.266] and area -105364
polygon 13 has 7171 vertices with bounding box [725165.9432/726383.9432] to [5172272.266/5173420.266] and area 646526
polygon 14 has 7083 vertices with bounding box [725746.9432/726675.9432] to [5172272.266/5173702.266] and area 281557
polygon 15 has 7108 vertices with bounding box [725895.9432/730344.9432] to [5172272.266/5177974.266] and area 22623264
polygon 16 has 801 vertices with bounding box [726360.9432/726744.9432] to [5174902.266/5175662.266] and area -219847
Regards from Chile,
Martin @rapidlasso

Neville Crasto
Feb 27, 2017, 8:44:15 AM2/27/17
to LAStools - efficient tools for LiDAR processing
- Based on the suggestions above, I tried the following but the output does not calculate the the area as expected with -vv option.
- I have a few "donuts" as plots and was hoping to use the negative area to find and remove islands.
- Lastools release is Version 170122.
So, I was wondering if there is another workaround to this or am I missing and option in the command.
lascanopy -i D:\chm\LAS\block3\normal\*.laz -merged -centroids -min -max -avg -std -p 1.4 5 10 15 20 25 30 -cov -c 1.4 5 10 15 20 25 -lop D:\chm\Block_3_FOR.shp -drop_class 7 12 -vv -o D:\chm\LAS\block3\metrics\Block3_metrics.csv
done with 0 polygonal plot [720443.6709/5414922.493] [720613.0502/5415080.541]. took 1.054 sec.
done with 1 polygonal plot [723207.0379/5414816.479] [723578.4451/5415226.176]. took 1.534 sec.
done with 2 polygonal plot [721701.9282/5414592.936] [722181.9077/5415351.58]. took 2.409 sec.
done with 3 polygonal plot [723272.8321/5414645.507] [723845.7482/5415232.172]. took 1.775 sec.
done with 4 polygonal plot [720381.0243/5414942.669] [720688.3563/5415499.132]. took 1.284 sec.
done with 5 polygonal plot [720459.2081/5415166.432] [720750.1709/5415499.186]. took 1.072 sec.
done with 6 polygonal plot [721852.9464/5414797.647] [722340.7699/5415516.531]. took 2.611 sec.
Neville Crasto
Feb 28, 2017, 6:46:41 PM2/28/17
to LAStools - efficient tools for LiDAR processing
Not that it makes a difference, but the above command should've been
lascanopy -i D:\chm\LAS\block3\normal\*.laz -merged -centroids -min -max -avg -std -p 5 25 50 75 95 99 -cov -c 1.4 5 10 15 20 25 -lop D:\chm\Block_3_FOR.shp -drop_class 7 12 -vv -o D:\chm\LAS\block3\metrics\Block3_metrics.csv
Sorry about that.
Martin Isenburg
Feb 28, 2017, 10:31:18 PM2/28/17
to LAStools - efficient command line tools for LIDAR processing
Hello Neville,
in this particular case the '-vv' or '-very_verbose' switch needs to come before the '-lop poly.shp' switch for the area reporting to work.
Regards,
Martin @rapidlasso
Reply all
Reply to author
Forward
0 new messages