Forest canopies and point densities
95 views
Skip to first unread message

floraproj...@gmail.com
Aug 2, 2017, 4:23:27 AM8/2/17
to LAStools - efficient tools for LiDAR processing, martin....@gmail.com
Hi,
I would like to generate histograms for the distribution of point densities on all vegetation heights.
I will be using polygons to select my areas.
Basically when presented as a graph, I want vegetation height on the y axis and point counts or % on the x axis.
What would be the command in this case to get these numbers?
?lasinfo
?-d 0 1 2 3 4 5 6 7 8 9 10 11 12 13 14 15 16 17 18 19 20
Regards
Cam
floraproj...@gmail.com
Aug 2, 2017, 5:27:10 AM8/2/17
to LAStools - efficient tools for LiDAR processing, martin....@gmail.com
I stumbled on the solution I was after >lasinfo -i "tile" -histo z 1 -o histo.txt
floraproj...@gmail.com
Aug 4, 2017, 11:42:11 AM8/4/17
to LAStools - efficient tools for LiDAR processing, martin....@gmail.com
How would I normalize this data or get the densities of the different strata? Does Lastools do this or do people use statistics programs to do this. Is this because the upper canopies limit comparable densities of points to lower canopies and therefore the data is not normal?

Martin Isenburg
Aug 5, 2017, 11:04:04 AM8/5/17
to LAStools - efficient tools for LiDAR processing
Hello,
note that the term "normalize" appeared twice in my answer. The first time it was referring to the fact that lasinfo with the '-histo z 1' option or the '-c 0 1 2 3 4 ...' option in lascanopy merely count the number of points per strata. To compute densities as a fraction out of 1 or as a percentage out of 100 you need to divide the strata counts with the summed up total of counts across all strata. The second time that the terms "normalize" appears what in respect to the input LiDAR points having their height above ground as their z coordinate instead of the original elevation.
So with lascanopy simply use the '-d 0 1 2 3 4 ...' instead of the '-c 0 1 2 3 4 ...' option and the counts are normalized for you. One thing to keep in mind is to make sure that there are sufficiently many points in your plot. The densities of the different strata are a statistical measure and you probably need at least 100 (or so?) returns per plot / per raster cell to make this statistic stable.
Regards,
Martin @rapidlasso
floraproj...@gmail.com
Aug 5, 2017, 3:00:59 PM8/5/17
to LAStools - efficient tools for LiDAR processing
Thanks I think I am on the right track then;
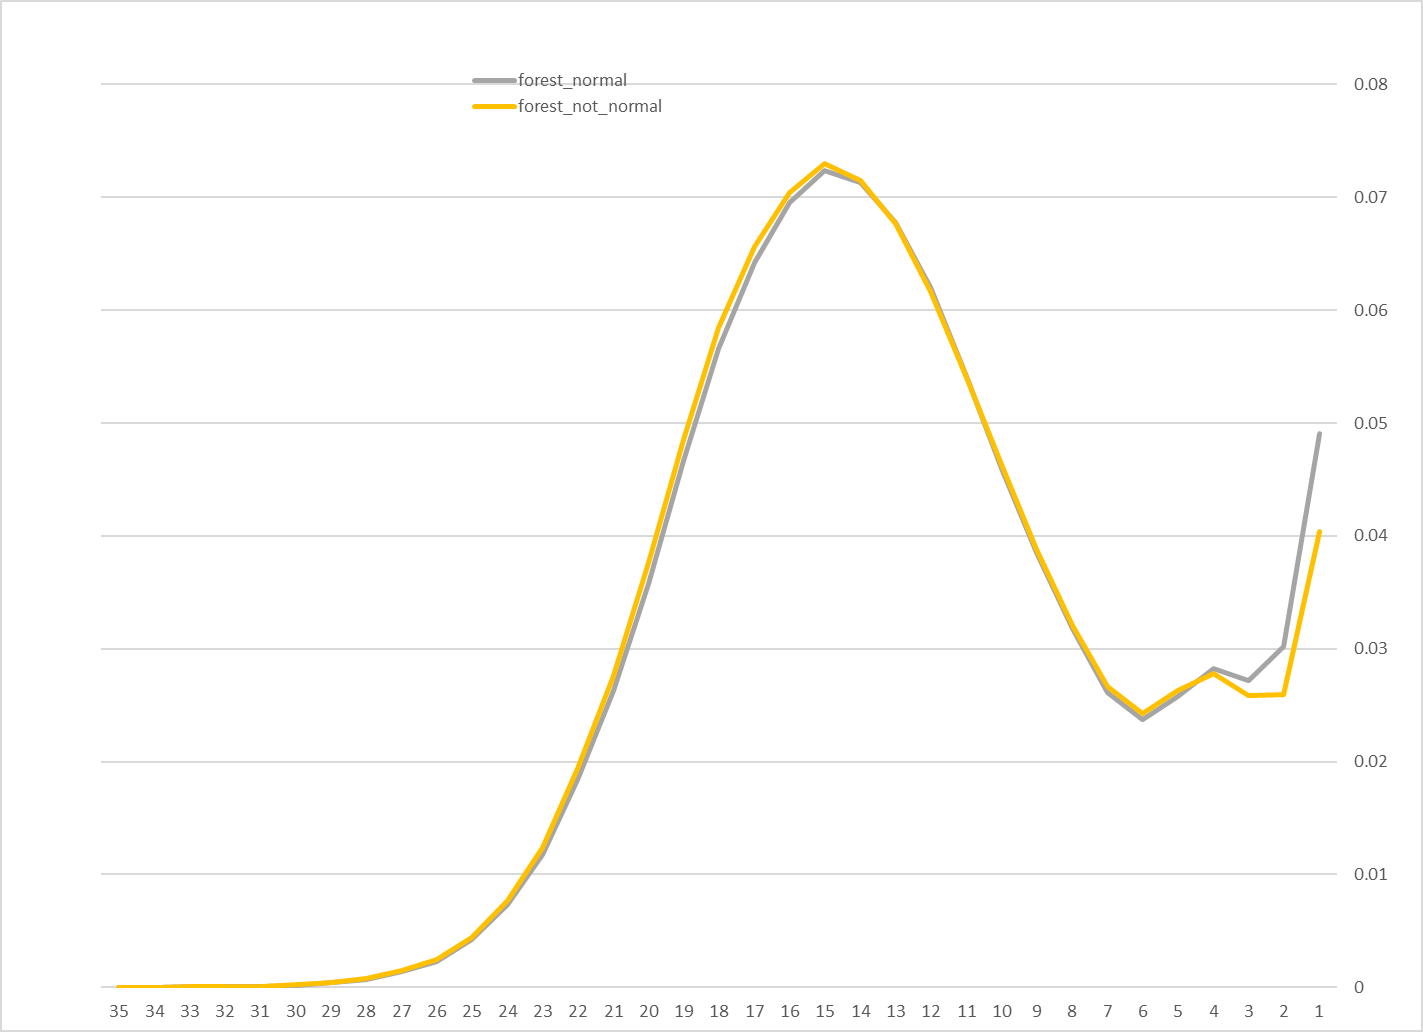
I attached a graph showing the counts as a fraction for some forest
The x axis is the normalized z value for the vegetation in meters and the y axis is the fraction of counts
The orange line is from the normalized height vegetation data
I tried to normalize the data further with the grey line by:
Using lasinfo to find the average spacing for the ground last returns (In my mind this method would fairly distribute all the vegetation returns): lasinfo -lof height.txt -merged -nh -nv -nmm -cd -last_only
The result was 0.65m spacings with 2.3msq density
Then I intended to average out all the returns using this calibration using lasthin -lof height.txt -drop_classification 2 -central -step 0.65 -odir "c:tiles" -olaz
Then to get my histogram I used lasinfo -lof thinned.txt -merged -nh nmm -nv -cd -histo z 1 -o hist_5.csv
Was this an appropriate use of the -central function? Did the central function average and centralize the data in that grid to the step value both in horizontal and vertical directions?
I noticed I cant generate an intensity histogram after doing this?
Regards
Cam
Reply all
Reply to author
Forward
0 new messages