clip LiDAR data by plot

Dwight Crouse

Tobias K Kohoutek

Irf
lascanopy -i *.laz -files_are_plots -int_avg -int_std -cov -gap -names -o output.csv
Tobi
--
Download LAStools at
http://lastools.org
http://rapidlasso.com
Be social with LAStools at
http://facebook.com/LAStools
http://twitter.com/LAStools
http://linkedin.com/groups/LAStools-4408378
Manage your settings at
http://groups.google.com/group/lastools/subscribe

Paul Magdon
Hi everyone,
I also like to push this issue. Lasclip runs excelent but when we have a large set of plots e.g. 100 we need to have an option to name the output lasfiles according to an attribute of the polygones e.g. plot_id.
I tested the suggestion to use '-names' but this is not available for lasclip.
Any suggestions?
Greetins Paul

Martin Isenburg

Susana Gonzalez
Martin,
I have run your script, works great!
Thanks
Susana

cai...@vicforests.com.au
I did try lasclip using multi plots. The question is that is it possible to name the out put laz file as the same as the clip shapefile's ID?
Regards
Cai Li I GIS Analyst, Resources I VicForests
Level 12, 461 Bourke Street, Melbourne Vic 3000 I G P O Box 191, Melbourne Vic 3001
T: +61 03 9608 9571 I F: +61 03 9608 9566 I E: cai...@vicforests.com.au
Notice:
This email and any attachments may contain information that is personal,
confidential, legally privileged and/or copyright. No part of it should be
reproduced, adapted or communicated without the prior written consent of the
copyright owner.
It is the responsibility of the recipient to check for and remove viruses.
If you have received this email in error, please notify the sender by return
email, delete it from your system and destroy any copies. You are not authorised
to use, communicate or rely on the information contained in this email.
Please consider the environment before printing this email.
Susana Gonzalez
Hi Cai,
Have a look in this email from Martin.
Cheers
Susana
cai...@vicforests.com.au
When doing a lascanopy command, is there way to put laz filename of input Lidar data in the output csv file?
Regards
Cai Li I GIS Analyst, Resources I VicForests
Level 12, 461 Bourke Street, Melbourne Vic 3000 I G P O Box 191, Melbourne Vic 3001
T: +61 03 9608 9571 I F: +61 03 9608 9566 I E: cai...@vicforests.com.au
Susana Gonzalez
Hi again,
You could use the plot name without clipping them
Plot list in a txt file: PlotName X Y Radius (space between columns)
C:\LAStools\bin\lascanopy.exe -v -i %NORMALISE%\*.laz ^
-names -loc %PLOTS%\Plots.txt ^
-p 25 75 95 ^
-fractions ^
-o %PLOTMETRICS%\Plots_metrics.csv
Cheers
Susana
From: last...@googlegroups.com [mailto:last...@googlegroups.com] On Behalf Of cai...@vicforests.com.au
Sent: Thursday, 30 November 2017 4:26 PM
To: last...@googlegroups.com
--
cai...@vicforests.com.au
Actually, I am using irregular shape polygons to test a lascanopy tool, so have to use clipped lidar point file that named as polygon id.
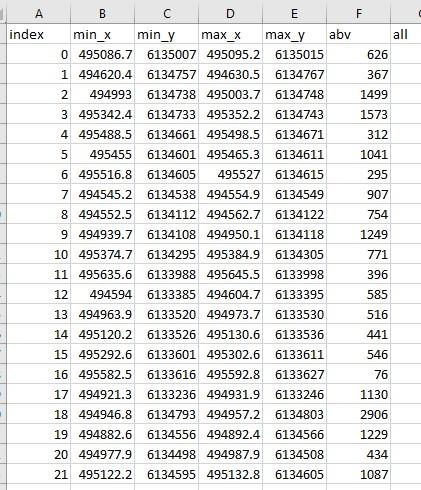
if without -name and input polygon shape file, the result likes
lascanopy -lof file_list.3192.txt -files_are_plots ^
-all -min -max -avg -std -ske -kur -qav -p ... 25 50 75 90 95 99 ^
-fractions -odir %outputcsv% -ocsv
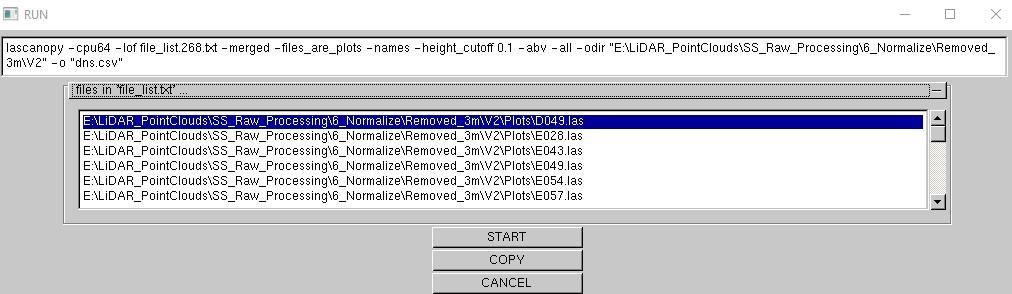
if i try -name .... as blow
lascanopy -lof file_list.3192.txt -files_are_plots
^
-all -min -max -avg -std -ske -kur -qav -p ... 25 50 75 90 95 99 ^
-fractions -odir %outputcsv% -ocsv ^
-names -lop %polygon%\polyg.shp
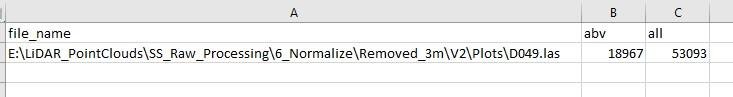
the result likes
Regards
Cai Li I GIS Analyst,
Resources I VicForests
Level 12, 461 Bourke Street, Melbourne Vic 3000 I G
P O Box 191, Melbourne Vic 3001
T: +61 03 9608 9571 I
F: +61 03 9608 9566 I E: cai...@vicforests.com.au
From:
Susana Gonzalez <susana....@interpine.nz>
To:
"last...@googlegroups.com"
<last...@googlegroups.com>,
Iain Clarke
Hi Martin,
I'm also keen to beta-test this mod, but I can't access the link due to the UTAS security systems.
Would you be able to place in a Google Drive folder and forward me the link please? Or some other method to
access the new lasclip.exe?
Cheers,
Iain Clarke
PhD Candidate
University of Tasmania
Sent: Thursday, 30 November 2017 7:40 AM
To: last...@googlegroups.com
Subject: RE: [LAStools] Naming clip LiDAR data as plot id
University of Tasmania Electronic Communications Policy (December, 2014).
This email is confidential, and is for the intended recipient only. Access, disclosure, copying, distribution, or reliance on any of it by anyone outside the intended recipient organisation is prohibited and may be a criminal offence. Please delete if obtained
in error and email confirmation to the sender. The views expressed in this email are not necessarily the views of the University of Tasmania, unless clearly intended otherwise.
Martin Isenburg
Martin Isenburg

Silvia Losada
On Thu, Nov 30, 2017 at 5:43 AM, <ca...@vicforests.com.au> wrote:
Thank you Susana,
Actually, I am using irregular shape polygons to test a lascanopy tool, so have to use clipped lidar point file that named as polygon id.
if without -name and input polygon shape file, the result likes
lascanopy -lof file_list.3192.txt -files_are_plots ^-all -min -max -avg -std -ske -kur -qav -p ... 25 50 75 90 95 99 ^
-fractions -odir %outputcsv% -ocsv

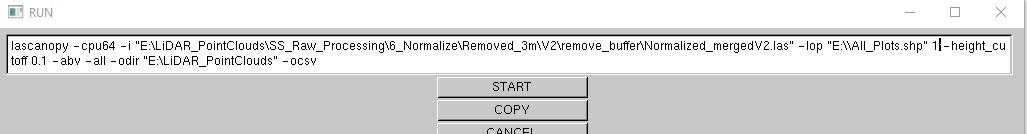
if i try -name .... as blow
lascanopy -lof file_list.3192.txt -files_are_plots ^-all -min -max -avg -std -ske -kur -qav -p ... 25 50 75 90 95 99 ^
-fractions -odir %outputcsv% -ocsv ^
-names -lop %polygon%\polyg.shp
the result likes
Regards
Cai Li I GIS Analyst, Resources I VicForests
Level 12, 461 Bourke Street, Melbourne Vic 3000 I G P O Box 191, Melbourne Vic 3001
T: +61 03 9608 9571 I F: +61 03 9608 9566 I E: ca...@vicforests.com.au