Using blast2dem to get DTM and DSM out of dense point cloud .laz files?
138 views
Skip to first unread message

Cynthia Gerlein-Safdi
Aug 12, 2016, 7:13:30 PM8/12/16
to LAStools - efficient tools for LiDAR processing
I am trying to get .asc files of the DTM and the DSM (elevation of forest canopy in this case) of a large dataset. I have been using blast2dem in the following way:
To generate canopy surface (DSM):
wine /Applications/LAStools/bin/blast2dem -i *.laz -odir /Users/cynthiagerlein/Desktop/LIDAR/CMS_Landscapes_Brazil_LiDAR_1302/data/AND_A01_2013_LiDAR_coverage_area/DSM_Canopy -oasc -elevation -elevation_meter -keep_first
To generate ground surface (DTM):
wine /Applications/LAStools/bin/blast2dem -i *.laz -odir /Users/cynthiagerlein/Desktop/LIDAR/CMS_Landscapes_Brazil_LiDAR_1302/data/AND_A01_2013_LiDAR_coverage_area/DTM_Ground -oasc -elevation -elevation_meter -keep_class 2
I haven't done any pre-classification on the data and I'm not completely sure what -keep_first does, but the results looks like a forest canopy, and is very similar to using -keep_class 3 4 5. Btw, I am not interesting in tiling using lastools.
The data I am using is available here: https://daac.ornl.gov/cgi-bin/dsviewer.pl?ds_id=1302
Could anyone explain what they think keep_first might do and whether or not it's the right way to get the DSM?
Thanks!!

Martin Isenburg
Aug 15, 2016, 4:00:58 PM8/15/16
to LAStools - efficient command line tools for LIDAR processing
Hello Cynthia,
Wow. Awesome free and open LiDAR data from the Carbon Monitoring System (CMS) of investigators Maiza Nara dos-Santos and Michael Keller. See here for more information.
http://daac.ornl.gov/CMS/guides/CMS_Landscapes_Brazil_LiDAR.html
You need to register before downloading but it is easy and fast:
https://daac.ornl.gov/cgi-bin/dsviewer.pl?ds_id=1302
I downloaded the first set of 15 LiDAR tiles matching 'AND*_2014.laz' and the lasinfo reports tell me that they are already classified and that the files have an average pulse density of well above 10 shots per square meter. That is pretty high density!!! Are there any forest inventory field plots in this area as well?
I recommend to always do a little bit of quality checking before starting to process the data. My minimal recommendation is to run a 'laszip -check' to make sure that the download is correct and the files are not truncated (or run 'lasvalidate' that also finds additional issues).
D:\LAStools\bin>laszip -i AND*.laz -check
SUCCESS for 'ANDL2940C9715_2014.laz'
SUCCESS for 'ANDL2940C9716_2014.laz'
SUCCESS for 'ANDL2940C9717_2014.laz'
SUCCESS for 'ANDL2940C9718_2014.laz'
SUCCESS for 'ANDL2940C9719_2014.laz'
SUCCESS for 'ANDL2950C9715_2014.laz'
ERROR: 'end-of-file during chunk with index 884' after 44200641 of 45379874 points
FAILED integrity check for 'ANDL2950C9716_2014.laz' after 44200641 of 45379874 points
ERROR: 'end-of-file during chunk with index 866' after 43323828 of 48962986 points
FAILED integrity check for 'ANDL2950C9717_2014.laz' after 43323828 of 48962986 points
SUCCESS for 'ANDL2950C9718_2014.laz'
SUCCESS for 'ANDL2950C9719_2014.laz'
SUCCESS for 'ANDL2960C9715_2014.laz'
SUCCESS for 'ANDL2960C9716_2014.laz'
SUCCESS for 'ANDL2960C9717_2014.laz'
SUCCESS for 'ANDL2960C9718_2014.laz'
SUCCESS for 'ANDL2960C9719_2014.laz'
Already the first check shows that two of the files on the server are not entirely intact. I tried to download them again and can confirm that the issue is definitely on the server. So there will be some missing points. I also like to run 'lasoverlap' to check for missing areas and vertical (or horizontal) flightline miss-alignment. For biomass areas maybe I am okay with a vertical error of up to 50 centimeter but want to know about (open) areas with more than 1 meter differences.
D:\LAStools\bin>lasoverlap -i AND*.laz ^
-min_diff 0.5 -max_diff 1 ^
-odir quality -opng ^
-utm 23south ^
-cores 4
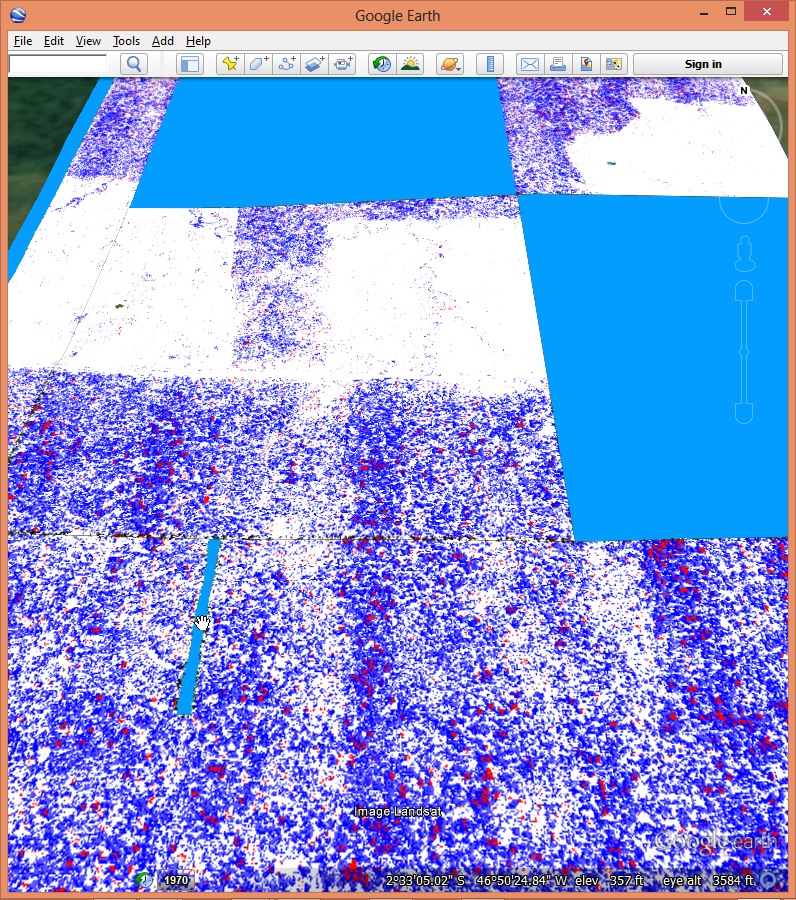
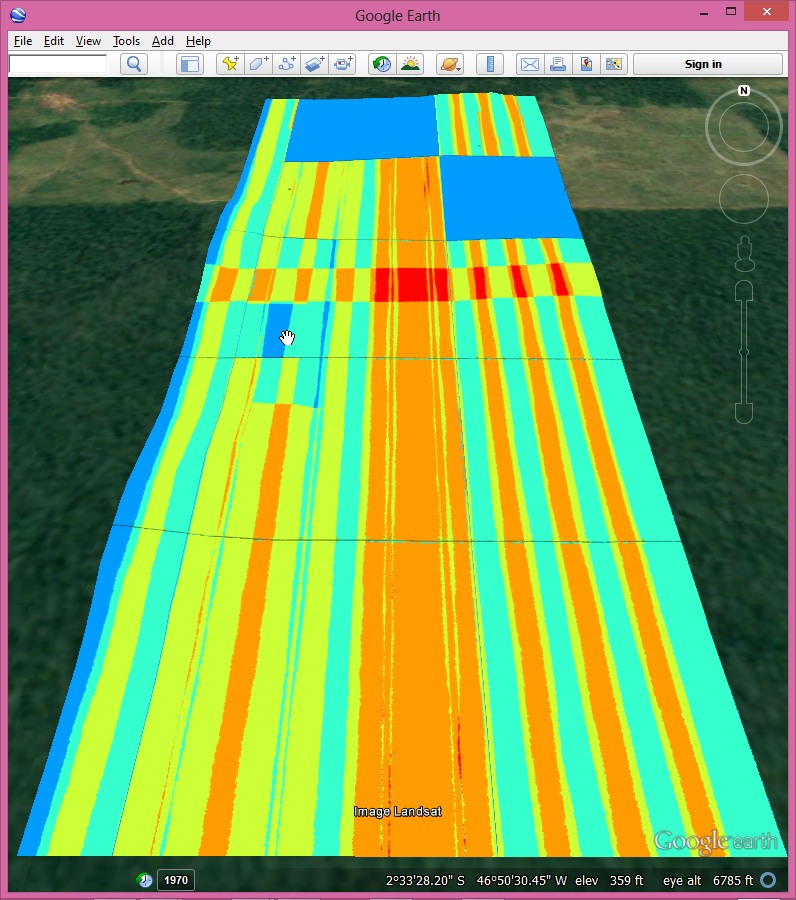
The resulting overlap image (attached) indicates more issues. It shows us that two of the tiles have no flightline information (e.g. the point source ID of each point is not properly initialized). This can be confirmed by looking at the lasinfo reports for ANDL2950C9719_2014.laz and ANDL2960C9718_2014.laz (attached) where we see that all point source IDs are 1. This is different, for example for ANDL2950C9717 _2014.laz where the point source ranges from 2 to 23. The area where the mouse pointer is where the aforementioned file truncation has happened ... there is less overlap due to some incomplete flightlines.
This also means that we do not get a meaningful difference image (attached) everywhere as we need to know which point is from which flightline in order to compute the elevation difference between them. In the open areas (no forest) we get good alignment (-> white) and elsewhere the red and blue seems to be caused by lack of penetration into the canopy and not by missalignment. One can usually "see" the flightlines more clearly in the "red" or the "blue" when there is an issue with alignment but here it is mostly penetration speckle with good alignment (-> white) in open areas.
So much for quality checking. We have not yet answered the real question. We get back to that. Until then please so some reading on how to generate a DSM / CHM on these blog articles.
Regards,
Martin @rapidlasso
0 new messages