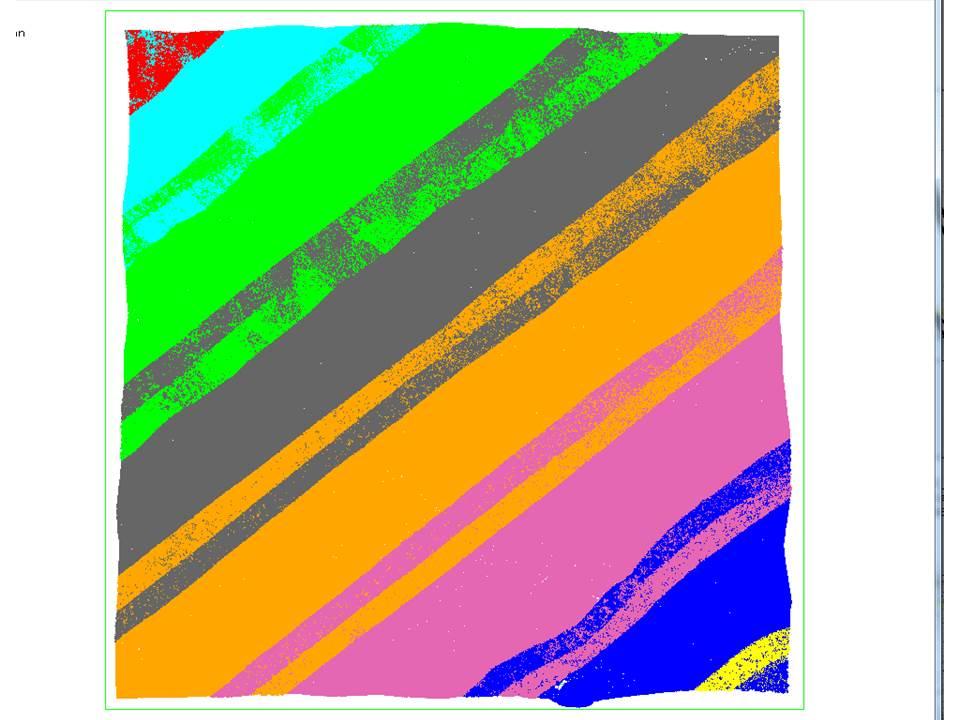
Overlapping flightline present after overage points flagged and removed

cgor...@hotmail.com

Terje Mathisen
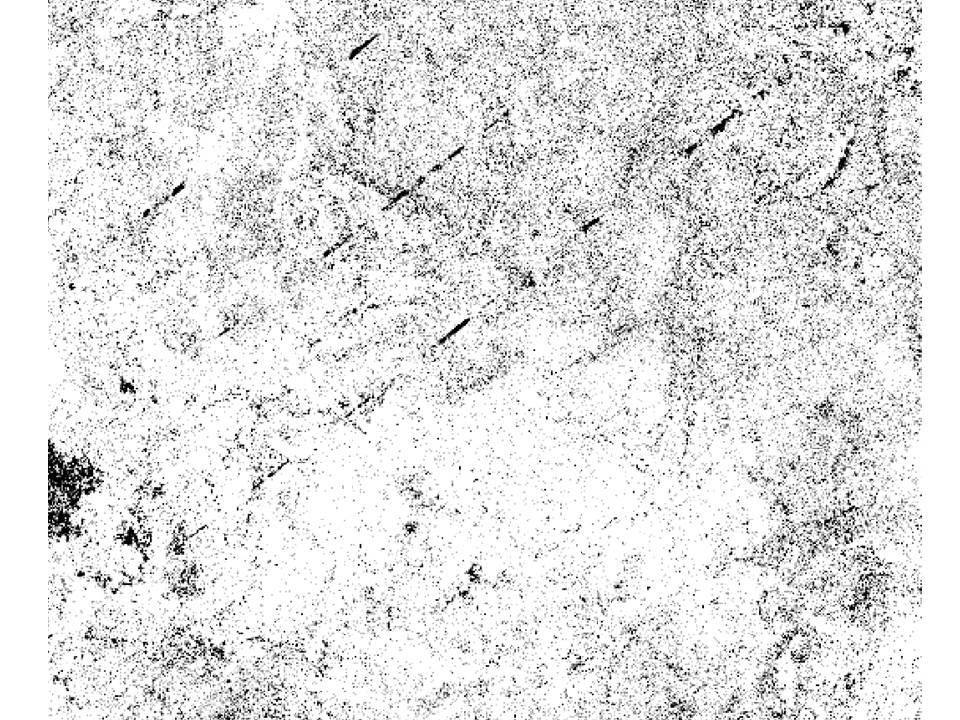
> Accounting for overage points is particularly important for me as I am
> ultimately aiming to measure percentage canopy cover within four
> 1m height classes between 1 - 4 m (i.e 1-2m off the ground, 2-3m off
> the ground etc etc), and it seems that my percentage cover estimates
> are hugely affected by the presence of overage points. This can be
> seen in Image3 which show percentage canopy cover between 1-2m; the
> dark diagonal banded areas are obviously not measuring canopy cover
> but identifying overalpping flight line areas.
>
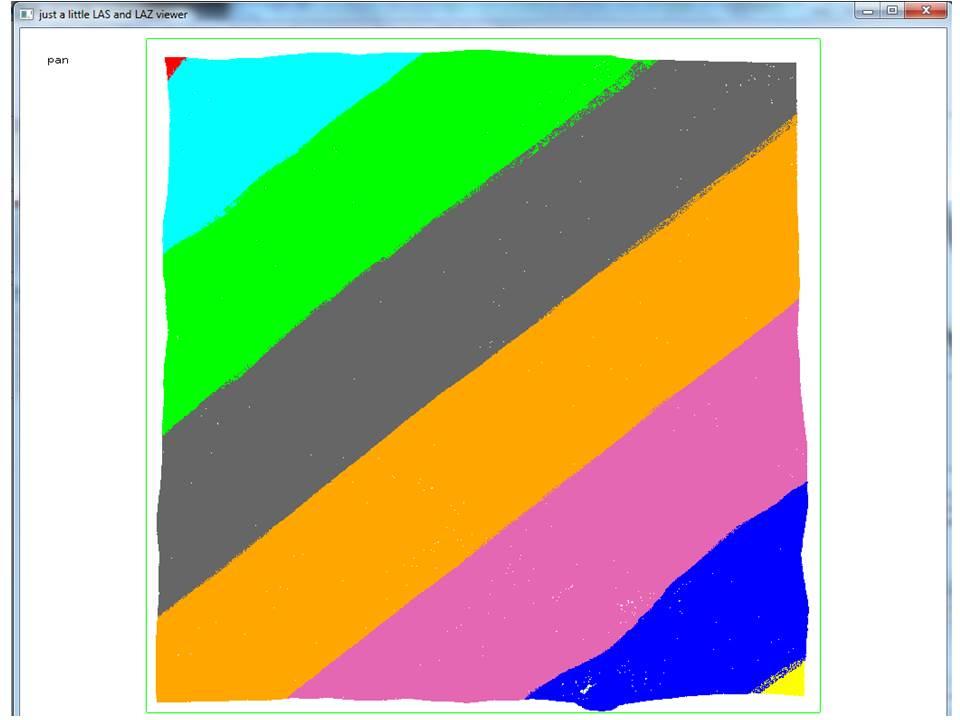
classification for orienteering mapping!
My solution works well and is quite simple to implement:
Instead of working with absolute counts of hits in the various height
bands I scale all numbers by the total count, i.e. I am really working
with percentages within a small (5 to 10 m diameter center-weighted
circle) patch around each particular spot.
This way I also avoid the small glitches you otherwise would get due to
variable point density across the flight direction, i.e. this
distribution depends on the scanning mirror construction.
It is quite possible that I could get equally good or better results by
removing overlap areas, but in that case I would also get a visible
staircase step whenever there is less than perfect height calibration
between flight lines.
Terje
--
- <Terje.M...@tmsw.no>
"almost all programming can be viewed as an exercise in caching"
cgor...@hotmail.com
Hello Terje, and thankyou for your rapid reply. Its nice to know that I'm stumbling where others have stumbled before :)
A quick follow up question regarding your response. At the moment I am calculating my percentage cover measure as a proportion of all points falling within and below the height layer of interest (the idea behind this is that in doing so I am accounting for laser attenuation at lower canopy layers which may confound my cover scores). For example, if I was to calculate percentage cover between 1 - 2 m above the ground, my percentage cover calculation would be: sum points 1 - 2 m / sum of points 0 - 2 m * 100. Is this what you are suggesting above? If so, this method is (i.e. sum points 1 -2 m / sum points 0.1 - 2 m * 100); presumably this is because the height error between overlapping flightlines areas is very high near the ground (as you would expect I guess).
Sorry to have to clarify this point however it would be nice to inform my method based on others experiences. And again, thanks for your help.
Chris Gordon
Terje Mathisen
>
> Hello Terje, and thankyou for your rapid reply. Its nice to know that
> I'm stumbling where others have stumbled before :)
>
> A quick follow up question regarding your response. At the moment I am
> calculating my percentage cover measure as a proportion of all points
> falling within and below the height layer of interest (the idea behind
> this is that in doing so I am accounting for laser attenuation at
> lower canopy layers which may confound my cover scores). For
> example, if I was to calculate percentage cover between 1 - 2 m above
> the ground, my percentage cover calculation would be: sum points 1 - 2
> m / sum of points 0 - 2 m * 100. Is this what you are suggesting
> above? If so, this method is (i.e. sum points 1 -2 m / sum points 0.1
> - 2 m * 100); presumably this is because the height error between
> overlapping flightlines areas is very high near the ground (as you
> would expect I guess).
>
a) First I count the number of points in each height band, for each 2x2m
cell.
b) For each cell I then calculate a full height distribution, i.e. I
scale all the (a) numbers by the total count. (I store this as a 0-255
byte value, so 255 for ground points would indicate a totally open area
with zero vegetation.
c) My next steps are related to converting these raw fractions to
vegetation: It is impossible to directly look at hits in chest/face
height, because they depend a lot on how much high canopy there is in
the area, but the histogram distribution from ground via low and medium
to high veg turns out to be quite significant, i.e. with the same types
of vegetation involved, two patches of approximately the same density
will tend to have similar height profiles.
My next stage therefore uses a set of trial and error manually
determined separators between classifications to get an initial result.
Using this starting point the surveyor makes one or a few quick testing
visits, determining areas that are typical in this terrain for each
classification whereupon I use these as benchmark distributions,
rerunning the entire process from (c) but this time I look for the best
match against all benchmarks.
BTW, in order to get statistically significant data, all the previous
2x2 cells are really the result of a center-weighter circle with radius
5 m around each spot!
d) The final stages consist of a low-pass filter which picks a majority
classification, also slightly center-weighted, among all those
preliminary decisions. This is in order to get a reasonable minimum size
for each separately mapped classification.
e) In order to convert these images to vector data I wrote a program
which detects all the multi-area meeting points, then it smooths the
connecting lines between them (i.e. another low-pass filter), before it
write outs DXF files describing each area, many of them having one or
more layers of internal islands, i.e. areas within areas.
Terje
> Sorry to have to clarify this point however it would be nice to inform
> my method based on others experiences. And again, thanks for your help.
>
> Chris Gordon
>