Filter points by Percentiles
164 views
Skip to first unread message

Irf
May 25, 2017, 7:09:08 AM5/25/17
to LAStools - efficient tools for LiDAR processing
Hello Martin,
Just wondering if anyone has an idea about filtering points using percentiles e.g. -drop_p_below 50, -keep_p_above 50, -keep_p_between 50 99 etc. There's no direct executable in LAStools afaik. Has anyone accomplished this using pipelines?

Michael Perdue
Jun 4, 2017, 3:10:56 AM6/4/17
to LAStools - efficient command line tools for LIDAR processing
Hello,
I have used workflows that could easily be modified to do what you're looking to do. The only issue is that it requires outside tools; namely GMT (Generic Mapping Tools). GMT is free and open source, but the syntax is quite terse and can be challenging for people not comfortable on the CLI.The general idea is to use GMT's blockmedian to isolate a set of points that define a surface for a specific percentile and then use lasheight to classify or drop points that fall either above or below the resulting surface. So;
:: find the boundaries of the file
lasinfo -i foo.laz...
min x y z: 464980.00 6635980.00 104.71
max x y z: 466019.99 6637019.99 352.88
...
:: Convert the file to txt for GMT's blockmedian
las2txt -parse xyz -i foo.laz -o foo.txt
:: Use blockmedian to isolate a set of points that represent p50 and p99 value for
:: Use blockmedian to isolate a set of points that represent p50 and p99 value for
:: each block. -T is the precentile (0-1), -Q is to take x & y from the z point that
:: represents the selected percentile, -R is the region and -I is the step size.
blockmedian -T0.5 -Q -R464980.00/466019.99/6635980.00/6637019.99 -I10 foo.txt > p50.xyzblockmedian -T0.99 -Q -R464980.00/466019.99/6635980.00/6637019.99 -I10 foo.txt > p99.xyz
:: -drop_p_below 50 (same as -keep_p_above 50)
:: -drop_p_above 50
lasheight -drop_above 0 -ground_points p50.xyz -i foo.laz -o bar.laz
:: -keep_p_between 50 99
lasheight -drop_above 0 -ground_points p99.xyz -i foo.laz -o bar.laz
lasheight -drop_below 0 -ground_points p50.xyz -i bar.laz -o foobar.laz
Cheers,
Mike
On Wed, May 24, 2017 at 11:22 PM, Irf <irfan...@gmail.com> wrote:
Hello Martin,Just wondering if anyone has an idea about filtering points using percentiles e.g. -drop_p_below 50, -keep_p_above 50, -keep_p_between 50 99 etc. There's no direct executable in LAStools afaik. Has anyone accomplished this using pipelines?
--
Download LAStools at
http://lastools.org
http://rapidlasso.com
Be social with LAStools at
http://facebook.com/LAStools
http://twitter.com/LAStools
http://linkedin.com/groups/LAStools-4408378
Manage your settings at
http://groups.google.com/group/lastools/subscribe
Irf
Jun 13, 2017, 4:46:23 AM6/13/17
to LAStools - efficient tools for LiDAR processing
Hello Mike,
Thank you sharing your workflow. I must appreciate the detailed comments along with the code. It made it a lot easier.
I tried to apply in on my data and it works if I am to run it on a grid (interval/step). This means that if I wanted to keep points above p90 (or -drop_p_below 90), blockmedian will calculate the 90th percentile in each grid cell and later lasheight will drop all the points below that p90. This, in a way, will be sensitive to the interval/step size. Since I am dealing with forestry plots, I am looking at one percentile value for a plot. lasheight will not run if there is only one point in -ground_points. If I couldn't find a way to use a single percentile value for the whole plot, I will follow your workflow (with your permission please) :).
Kind regards,
Irf
Irf
Jun 14, 2017, 2:25:20 AM6/14/17
to LAStools - efficient tools for LiDAR processing
Hi again Mike,
I did the some tests to conclude that your workflow can be implemented in LAStools alone.
Firstly, I created a final laz output, using your (GMT) workflow, with points above the 50th and the 90th percentile.
Secondly, I created a final laz output, using LAStools only, with points above the 50th and the 90th percentile.
The final output, from both the methods, is not very different from each other. A couple of points were missing in LAStools output (approx. 12 in 4000)
Instead of using 'blockmedian' in your workflow, I calculated the percentiles using lascanopy as follows:
lascanopy -i foo.laz -p 50 -step 1.0 -height_cutoff 0 -o p50_lt.xyz
lascanopy -i foo.laz -p 90 -step 1.0 -height_cutoff 0 -o p90_lt.xyz
Moreover, there's no need to find data boundaries or convert data to a text file.
Kind regards,
Irf
On Sunday, June 4, 2017 at 5:10:56 PM UTC+10, michaelperdue99 wrote:

Martin Isenburg
Jun 14, 2017, 11:28:12 AM6/14/17
to LAStools - efficient command line tools for LIDAR processing
Hello,
If you are using lascanopy to compute a 50% percentile surface of *all* LiDAR points (possibly unnormalized) you should make sure to
(a) set the -height_cutoff -500 to be well below all LiDAR points. even for normalized LiDAR I would set it to -2 or so as the ground TIN may cover some bumps in the ground and the points in the bump have small negative elevations after normalization.
(b) use a sufficiently large '-step 5' or '-step 10' as percentiles are a statistical measure that makes only sense if there are sufficiently many points (over 50, over 100 ?!?) used in the computation
(c) use BIL instead of XYZ as the raster output format for efficiency.
Below first a simple, then a more involved example using two different 50th percentile surface of the "classified" LiDAR data set from the Pentagon that you can download from our "LiDAR leaks" page here.
================================
50th percentile surface at different densities
================================
lascanopy -i pentagon.laz ^
-step 10 ^
-height_cutoff -500 ^
-p 50 -all ^
-o pentagon_10m.bil
lascanopy -i pentagon.laz ^
-step 5 ^
-height_cutoff -500 ^
-p 50 -all ^
-o pentagon_05m.bil
lascanopy -i pentagon.laz ^
-step 2 ^
-height_cutoff -500 ^
-p 50 -all ^
-o pentagon_02m.bil
lascanopy -i pentagon.laz ^
-step 1 ^
-height_cutoff -500 ^
-p 50 -all ^
-o pentagon_01m.bil
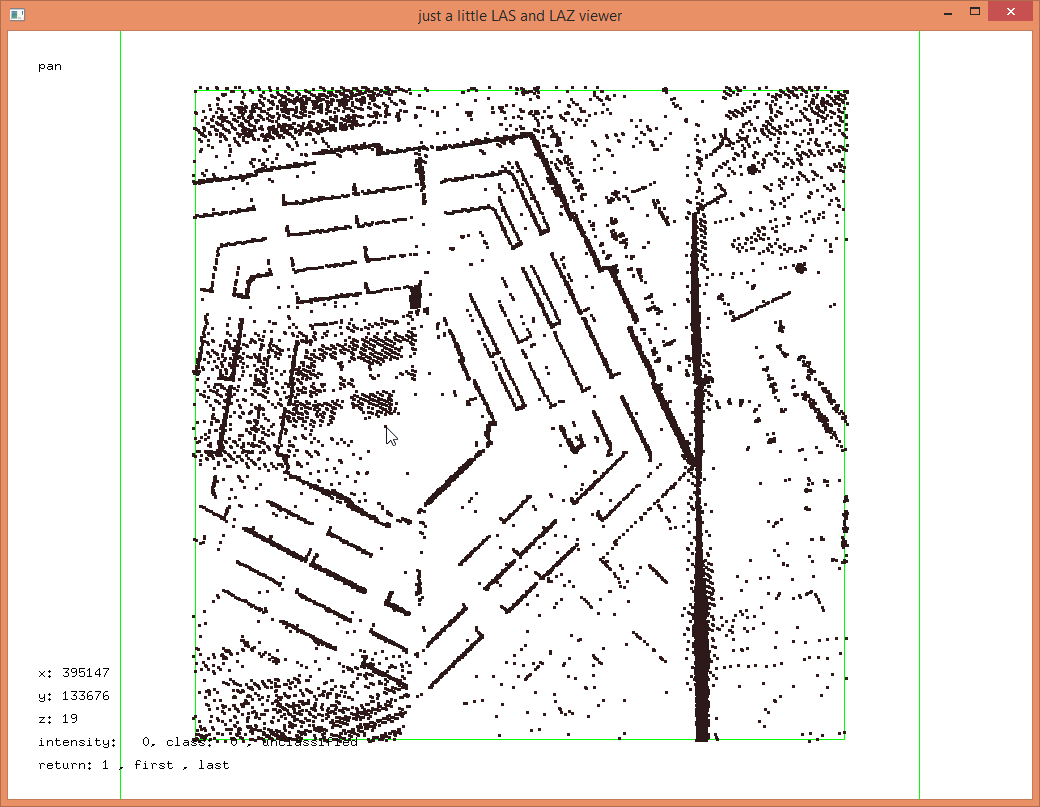
This also generates an *all* raster that contains counters that indicate how many points were used for the 50th percentile computation in each cell. This makes is easy to see if there are some cells that used too few returns for the percentile computation (see attached screen shot).
lasview -i pentagon_01m_all.bil -keep_z 0 20
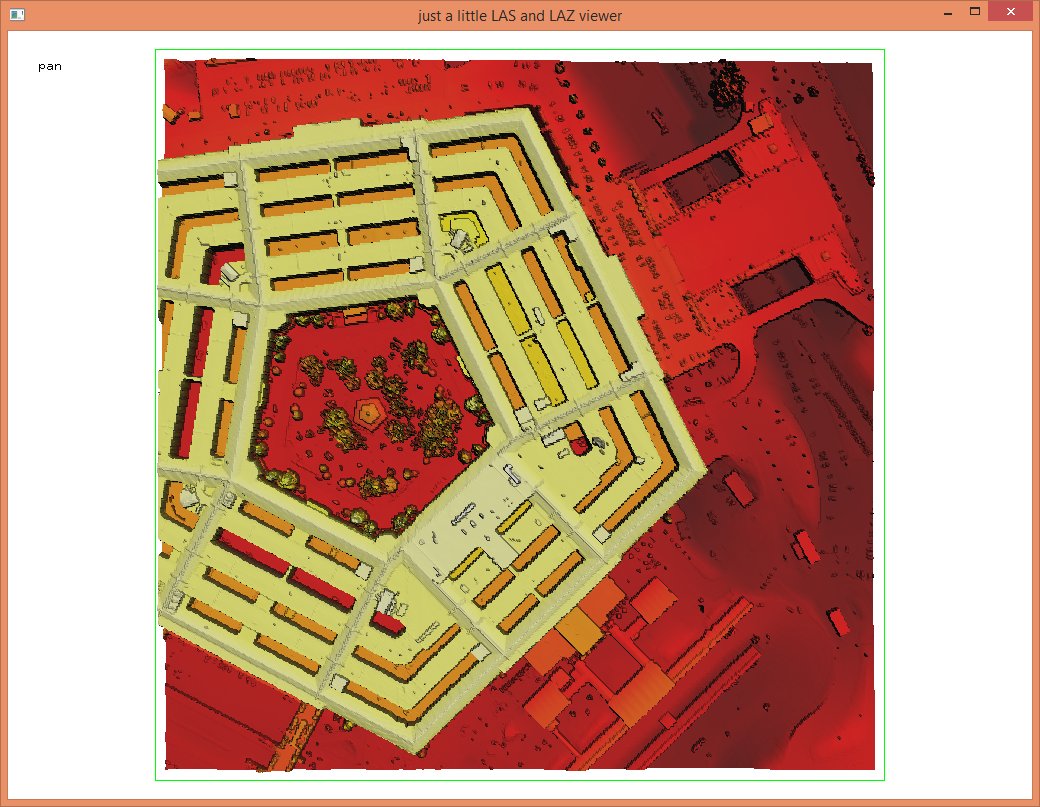
You can easily compare different surfaces:
lasview -i pentagon_*m_p50.bil -faf
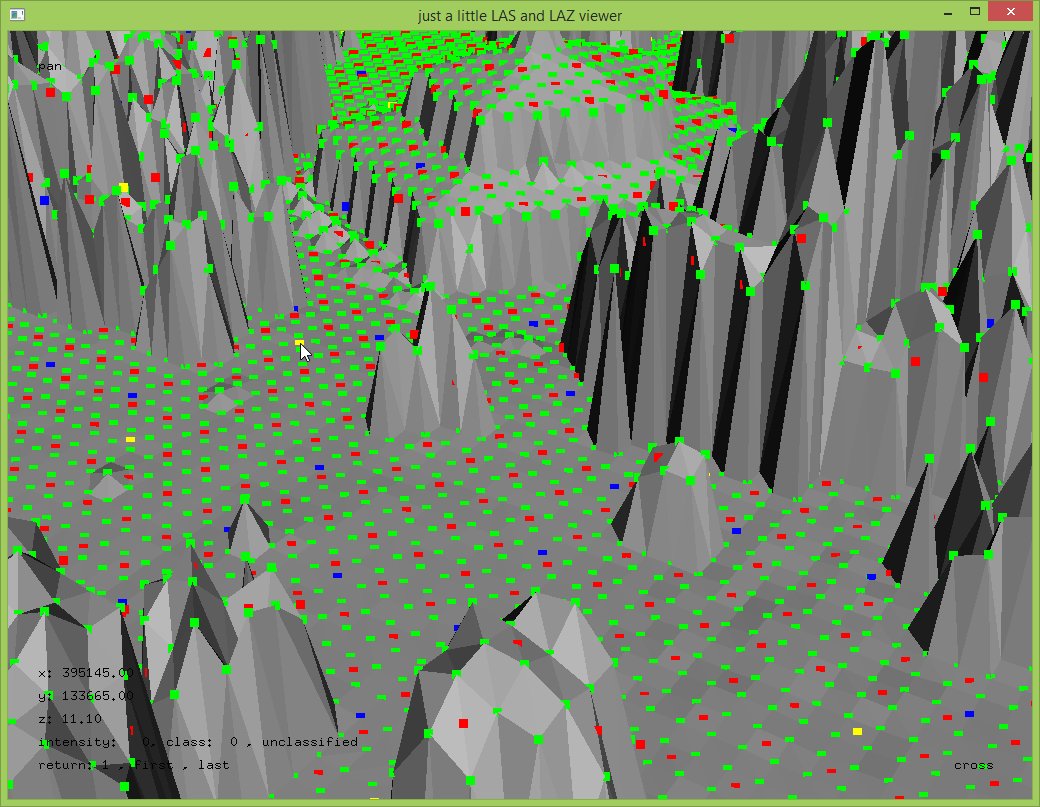
press <c> a couple of times to color the points from different files differently press <0> <1> <2> <3> to select the 1, 2, 5, and 10 meter points and press <t> to triangulate each of them into a surface. press <h> a couple of times for your favorite shading (see attached surfaces).
press <a> to see all of them. press <x> to select an area of interest for closer inspection. hang "drop lines" of 0.5 meters on each point via the menu. The attached image zooms in on the cafeteria you see the 50th percentile 1m surface together with the 1m (green), 2m (red), 5m (blue), and the 10m (yellow) points. The arrow of the mouse points to one of the latter.
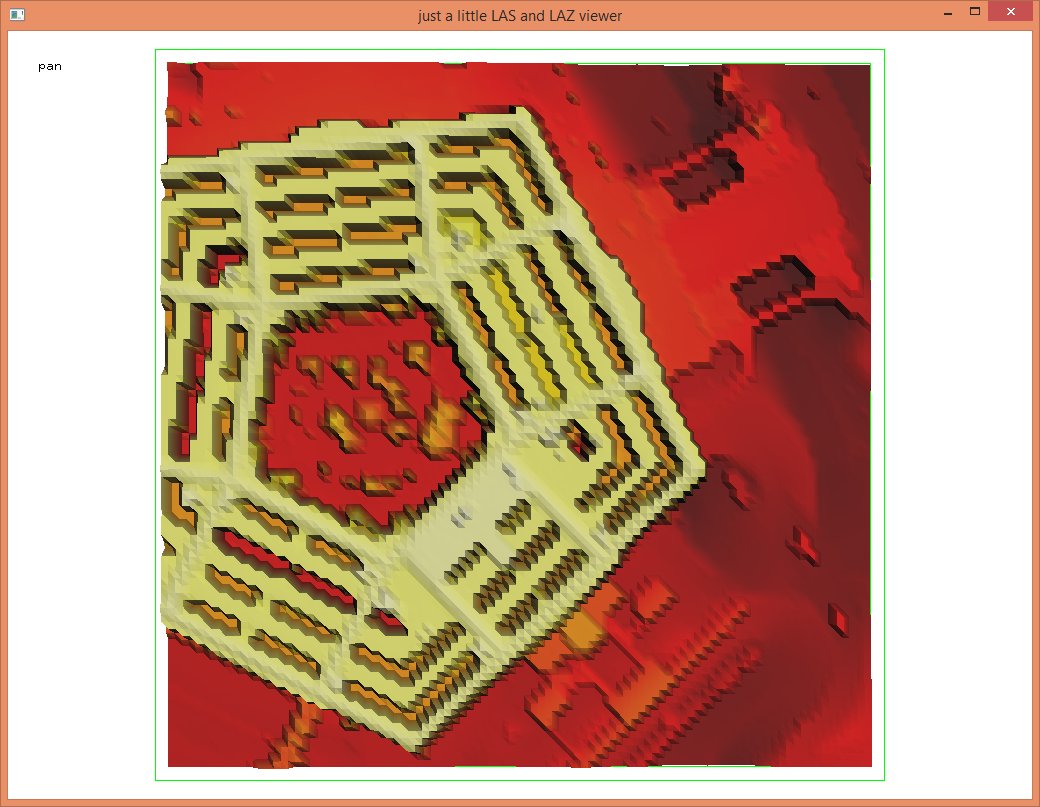
=====================
fancier: overlapping grid cells
=====================
Now if you wanted to use a lower the effect of the discrete grid and *smooth* the surface by using overlapping cells in which you compute the 50th percentiles then do as follows for the 5m grid. Do 2x2=4 or 3x3=9 or 4x4=16 or 5x5=25 runs and each time shift the grid slightly with the \-grid_ll 2.5 2.5' option. I only show the
lascanopy -i pentagon.laz ^
-step 5 ^
-grid_ll 0 0 ^
-height_cutoff -500 ^
-p 50 ^
-o pentagon_05m_0_0.bil
lascanopy -i pentagon.laz ^
-step 5 ^
-grid_ll 2.5 0 ^
-height_cutoff -500 ^
-p 50 ^
-o pentagon_05m_1_0.bil
lascanopy -i pentagon.laz ^
-step 5 ^
-grid_ll 0 2.5 ^
-height_cutoff -500 ^
-p 50 ^
-o pentagon_05m_0_1.bil
lascanopy -i pentagon.laz ^
-step 5 ^
-grid_ll 2.5 2.5 ^
-height_cutoff -500 ^
-p 50 ^
-o pentagon_05m_1_1.bil
And the result of merging them all together is also attached as an image.
lasview -i pentagon_05m_*_p50.bil -faf
Next merge them into one file:
las2las -i pentagon_05m_*_p50.bil ^
-merged ^
-o pentagon_05m_2x2_p50.laz
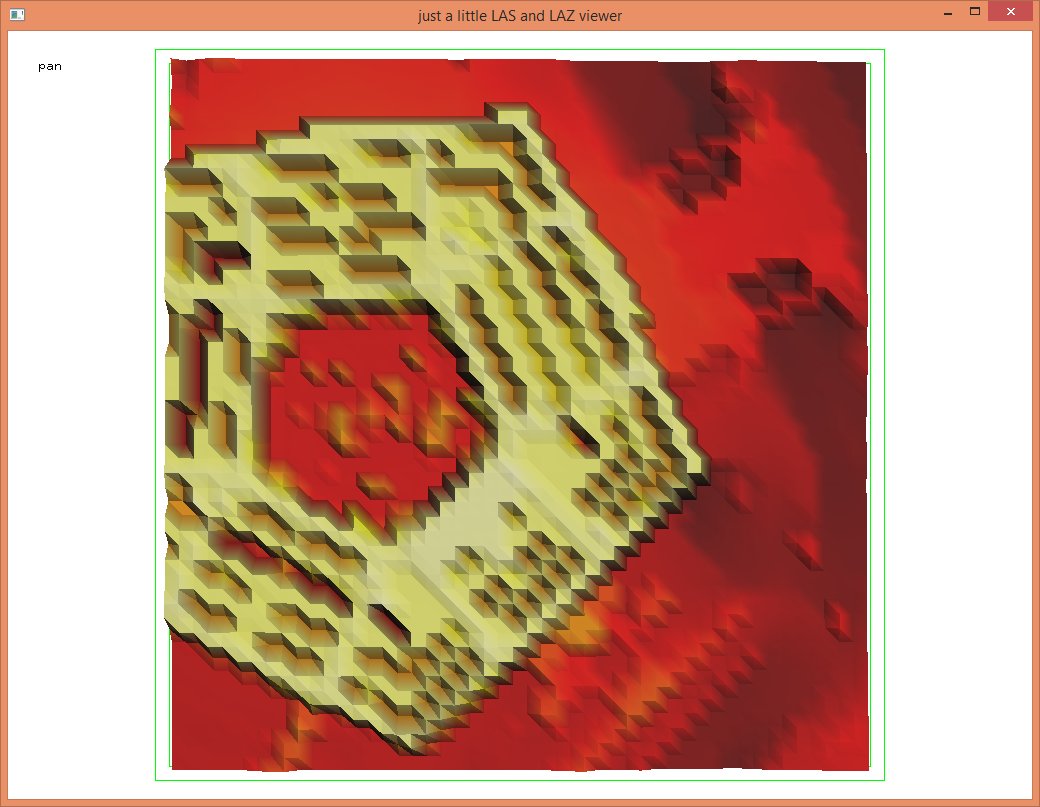
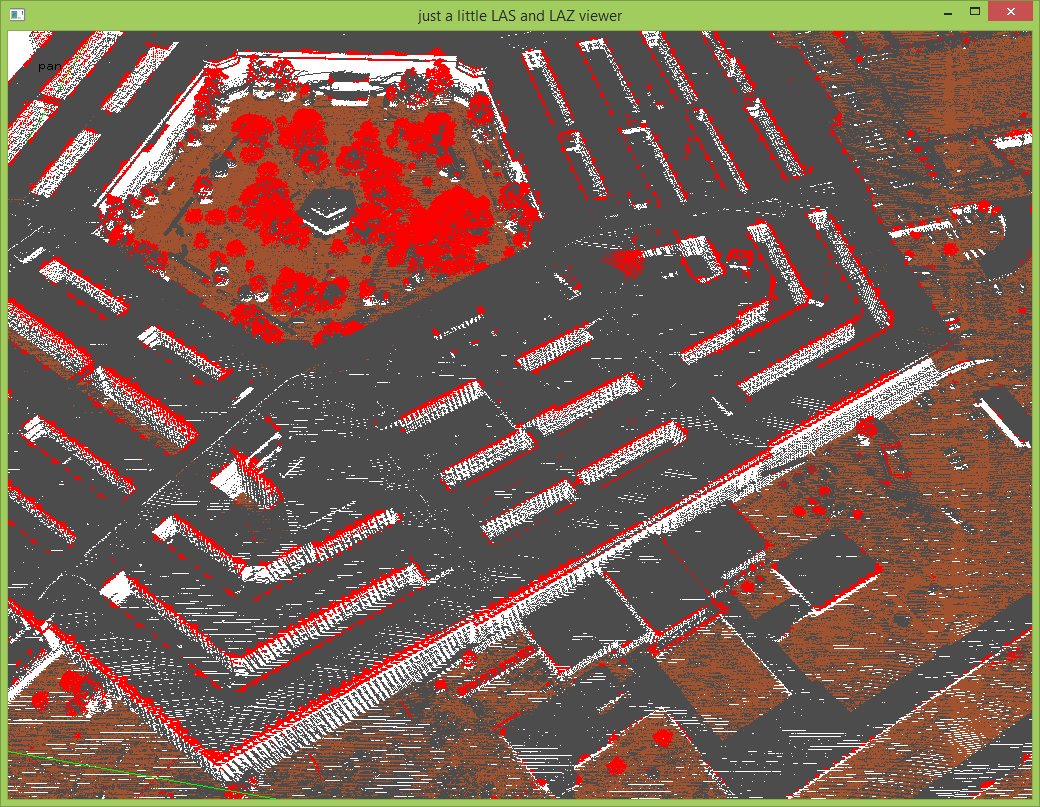
And then - for example - mark all the points that are 2.5 meters above the 50th percentile surface as *red* keypoints:
lasheight -i pentagon.laz ^
-ground_points pentagon_05m_2x2_p50.laz ^
-classify_above 2.5 8 ^
-o pentagon_classified_p50.laz
The result is also shown as an attached screen shot.
Regards.
Martin @rapidlasso
Reply all
Reply to author
Forward
0 new messages