Can the axis and points be set to have different "Quality" values?
147 views
Skip to first unread message

rhizomorph
Aug 21, 2011, 2:54:42 PM8/21/11
to Jzy3d
I'm putting together a program to plot the PCA values of data vectors
in 3d using scatter plots. However it seems that points do not
accurately render the depth - points that should NOT be visible
because they are behind a cloud of other closer points will still be
visible. Points that I know should be behind others based on their xyz
values end up being visible anyway. The only way I've found to correct
this is by initializing my chart using:
chart = new GraphChart(new Quality(true, false, true, true, true,
true, true), "swing");
...where the alphaActivated value is set to false. Why this should
even affect the correct rendering of distance is beyond me (I would
think depthActivated should affect that behavios, no?). Anyway, that
seems to correct the problem of depth for scatter points, but it
unfortunately also leaves me with a very choppy axis grid, instead of
the smooth anti-aliased grid I would get using a different Quality
setting. Is there any way to have the axis drawn with a higher quality
setting, while having the scatter group drawn with the setting that
gives correctly depth?

Martin Pernollet
Aug 22, 2011, 3:09:14 AM8/22/11
to jz...@googlegroups.com
Hi,
With open gl, pixelized polygons or points have a z buffer (distance from cam) for each pixel. Pixel are only drawn if the z value is lower than any existing pixel at that position. This works fine for opaque objects
Things are little different for a scene made of translucent objects. Indeed to render objects "behind" another one, you must render the "behind objects" first, and the covering object must be rendered after with an alpha blending method. This is why it is necessary to:
- desactivate depth buffer,
- activate the alpha blending to allow mixing the colors
In this mode, objects need to be sorted manually (using an OrderingStrategy).
These settings are defined by Quality and used by View.init(gl) Looking at this method should help you understanding what may be wrong with rendering settings.
Does this help?
rhizomorph
Aug 24, 2011, 1:59:18 PM8/24/11
to Jzy3d
Thanks for your reply. After looking into it more closely, I realized
that to get the look I desire I need to be able to set sampleBuffers
to true in GLCapabilities. I was able to do this by extending
GraphChart and overriding initializeCanvas. It reduces performance a
bit when resizing the canvas, but otherwise still pretty fast when
rotating/interacting with it.
However, I also realized that I need to be able to change the font for
the axis labels (independently of the tick marks) because I'm writing
a program that will be producing images to be used in academic
publications. From the source code, it looks like this drawing of axis
labels is hard-coded into the AxeBox class - the default behavior is
to render the text using a TextBitmap, but there is also another class
(not of the same super class) called TextRenderer, but I can't seem to
find a way to use that to change the font either.
Is there anyway that I can make the changes I need to the source code
myself? I tried checking out the latest source (via csv) using
Netbeans, but for the life of me I cannot seem to be able to create a
valid Netbeans project from the Jzy3D source without getting a host of
errors. It looks like the source on the repository uses different
functionality than the compiled 0.8.4 Jar file, but even when I
download the runtime Jars on the repository, I still get errors.
Is there a *working* (i.e. compilable) Netbeans project version of
Jzy3D that uses the most recent source code? I desperately need to
make some modifications to allow for more customizations.
Thanks.
On Aug 22, 3:09 am, Martin Pernollet <martin.pernol...@gmail.com>
wrote:
> Hi,
>
> With open gl, pixelized polygons or points have a z buffer (distance from
> cam) for each pixel. Pixel are only drawn if the z value is lower than any
> existing pixel at that position. This works fine for opaque objects
>
> Things are little different for a scene made of translucent objects. Indeed
> to render objects "behind" another one, you must render the "behind objects"
> first, and the covering object must be rendered after with an alpha blending
> method. This is why it is necessary to:
> - desactivate depth buffer,
> - activate the alpha blending to allow mixing the colors
>
> In this mode, objects need to be sorted manually (using an
> OrderingStrategy).
>
> These settings are defined by Quality and used by View.init(gl) Looking at
> this method should help you understanding what may be wrong with rendering
> settings.
>
> Does this help?
>
> 2011/8/21 rhizomorph <neural.symph...@gmail.com>
>
> With open gl, pixelized polygons or points have a z buffer (distance from
> cam) for each pixel. Pixel are only drawn if the z value is lower than any
> existing pixel at that position. This works fine for opaque objects
>
> Things are little different for a scene made of translucent objects. Indeed
> to render objects "behind" another one, you must render the "behind objects"
> first, and the covering object must be rendered after with an alpha blending
> method. This is why it is necessary to:
> - desactivate depth buffer,
> - activate the alpha blending to allow mixing the colors
>
> In this mode, objects need to be sorted manually (using an
> OrderingStrategy).
>
> These settings are defined by Quality and used by View.init(gl) Looking at
> this method should help you understanding what may be wrong with rendering
> settings.
>
> Does this help?
>
rhizomorph
Aug 24, 2011, 3:08:38 PM8/24/11
to Jzy3d
Also - is it possible to add a textbox annotation to a plot? For
example, if I wanted to have a text label next to a point (but
optionally have that label inside an opaque box with a background/
border)?
example, if I wanted to have a text label next to a point (but
optionally have that label inside an opaque box with a background/
border)?
Martin Pernollet
Aug 24, 2011, 4:52:49 PM8/24/11
to jz...@googlegroups.com
2011/8/24 rhizomorph <neural....@gmail.com>
Thanks for your reply. After looking into it more closely, I realized
that to get the look I desire I need to be able to set sampleBuffers
to true in GLCapabilities. I was able to do this by extending
GraphChart and overriding initializeCanvas.
That's lot of work to set a boolean. I believe I should provide an easier access to GLCaps.
It reduces performance a
bit when resizing the canvas, but otherwise still pretty fast when
rotating/interacting with it.
Shall I ask you the piece of code to give a try?
However, I also realized that I need to be able to change the font for
the axis labels (independently of the tick marks) because I'm writing
a program that will be producing images to be used in academic
publications. From the source code, it looks like this drawing of axis
labels is hard-coded into the AxeBox class - the default behavior is
to render the text using a TextBitmap, but there is also another class
(not of the same super class) called TextRenderer, but I can't seem to
find a way to use that to change the font either.
Yes, text management is bad with 0.8.x, but starting from 0.9, all text renderers implement ITextRenderer. In 0.9, the AxeBox uses an ITextRenderer reference, I should just add a way to inject another text renderer in it.
Is there anyway that I can make the changes I need to the source code
myself? I tried checking out the latest source (via csv) using
Netbeans, but for the life of me I cannot seem to be able to create a
valid Netbeans project from the Jzy3D source without getting a host of
errors.
The server runs subversion, may that be the reason? :)
The root is an eclipse project with a simple structure
It looks like the source on the repository uses different
functionality than the compiled 0.8.4 Jar file, but even when I
download the runtime Jars on the repository, I still get errors.
The 0.8.4 sources are stored in a branch (http://code.google.com/p/jzy3d/source/browse/#svn%2Fbranches%2F0.8.1)
The trunk (http://code.google.com/p/jzy3d/source/browse/#svn%2Ftrunk) is 0.9. If you want to download the compiled 0.9 jars go there: http://www.jzy3d.org/releases/0.9alpha2/
There are demos to work with all the text renderers, you will like it!
Scott Davis
Aug 24, 2011, 11:04:36 PM8/24/11
to jz...@googlegroups.com
That's lot of work to set a boolean. I believe I should provide an easier access to GLCaps.
Lol yeah it was, but the GLCapabilities needs to be set at the time of instantiation, so it needed to be modified in the constructor and thus required overriding a few classes.
Shall I ask you the piece of code to give a try?
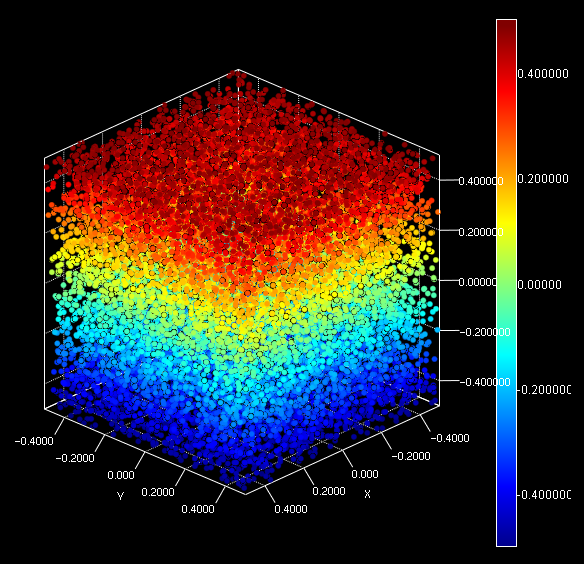
Here is a modification of the MultiColorScatterDemo demo. I think the reason you might not have noticed before is because all the scatter plot demos in the api use very small dots. But when using larger dots, it becomes apparent how the lower quality setting affects their appearance. Specifically, it has to do with polygon shading and how the point is rounded out. The setting that allows for proper distance rendering unfortunately also results in jagged edges around the point. It's harder to describe than it is to see, so here is a way to reproduce it.
In order to "correct" the problem, I've modified a few classes (and I'm using the 0.9 source, which I finally figured out how to compile in Netbeans): Chart, CanvasSwing, and CanvasAWT. They've all been modified in a similar manner - adding a constructor to allow for a GLCapabilities object to be passed (this is where one can optionally turn on sampleBuffers before the underlying GLJPanel canvas is instantiated. The changes still leave the original constructors in place, in case they are called from other parts of the API that I don't want to break.
CanvasSwing:
public CanvasSwing(Scene scene, Quality quality) {
this(scene, quality, org.jzy3d.global.Settings.getInstance().getGLCapabilities());
}
public CanvasSwing(Scene scene, Quality quality, GLCapabilitiesImmutable glci) {
super(glci);
view = scene.newView(this, quality);
renderer = new Renderer3d(view);
addGLEventListener(renderer);
setFocusable(true);
requestFocusInWindow();
}
CanvasAWT:
public CanvasAWT(Scene scene, Quality quality, GLCapabilitiesImmutable glci){
this(scene, quality, false, false, glci);
}
/** Initialize a Canvas3d attached to a {@link Scene}, with a given rendering {@link Quality}.*/
public CanvasAWT(Scene scene, Quality quality, boolean traceGL, boolean debugGL){
this(scene, quality, traceGL, debugGL, org.jzy3d.global.Settings.getInstance().getGLCapabilities());
}
public CanvasAWT(Scene scene, Quality quality, boolean traceGL, boolean debugGL, GLCapabilitiesImmutable glci){
super(glci);
view = scene.newView(this, quality);
renderer = new Renderer3d(view, traceGL, debugGL);
addGLEventListener(renderer);
animator = new Animator(this);
animator.start();
setAutoSwapBufferMode(true);
}
Chart:
private GLCapabilities capabilities; // Add this variable
public Chart(Quality quality, String chartType) {
this(quality, chartType, org.jzy3d.global.Settings.getInstance().getGLCapabilities());
}
// New constructor to allow for a modified GLCapabilities instance.
public Chart(Quality quality, String chartType, GLCapabilities capabilities) {
this.capabilities = capabilities;
controllers = new ArrayList<ChartCameraController>(1);
// Set up the scene and 3d canvas
scene = initializeScene(quality.isAlphaActivated());
canvas = initializeCanvas(scene, quality, chartType);
// Set up the view
view = (ChartView) canvas.getView();
view.setBackgroundColor(Color.WHITE);
}
protected ICanvas initializeCanvas(Scene scene, Quality quality, String chartType) {
if ("awt".compareTo(chartType) == 0) {
return new CanvasAWT(scene, quality, capabilities);
} else if ("swing".compareTo(chartType) == 0) {
return new CanvasSwing(scene, quality, capabilities);
} else if ("offscreen".compareTo(chartType) == 0) {
return new OffscreenCanvas(scene, quality, GLProfile.getDefault());
} else {
throw new RuntimeException("unknown chart type:" + chartType);
}
}
Now here is a modified version of the MultiColorScatterDemo that illustrates the difference.
public MultiColorScatterDemo2(){
// Create the dot cloud scene and fill with data
int size = 20000;
float x;
float y;
float z;
Coord3d[] points = new Coord3d[size];
for(int i=0; i<size; i++){
x = (float)Math.random() - 0.5f;
y = (float)Math.random() - 0.5f;
z = (float)Math.random() - 0.5f;
points[i] = new Coord3d(x, y, z);
}
Quality quality = new Quality(true, true, true, true, true, true, false);
GLCapabilities capabilities = org.jzy3d.global.Settings.getInstance().getGLCapabilities();
capabilities.setSampleBuffers(false); // false = ragged edges around large points. true = smooth rounding.
capabilities.setNumSamples(2);
MultiColorScatter scatter = new MultiColorScatter( points, new ColorMapper( new ColorMapRainbow(), -0.5f, 0.5f ) );
scatter.setWidth(6);
chart = new Chart(quality, "awt", capabilities);
chart.getAxeLayout().setMainColor(Color.WHITE);
chart.getView().setBackgroundColor(Color.BLACK);
chart.getScene().add(scatter);
scatter.setLegend( new ColorbarLegend(scatter, chart.getView().getAxe().getLayout(), Color.WHITE, null) );
scatter.setLegendDisplayed(true);
}
Yes, text management is bad with 0.8.x, but starting from 0.9, all text renderers implement ITextRenderer. In 0.9, the AxeBox uses an ITextRenderer reference, I should just add a way to inject another text renderer in it.
I ran the demo but haven't had a chance to play with it in my program yet. But this definitely look promising! Great work! :)
The server runs subversion, may that be the reason? :)The root is an eclipse project with a simple structure
Yeah I meant subversion - long day. Anyway, I did figure it out though, thanks ;)
1) When I choose "swing" instead of "awt", every now and then I'll get a NPE error when I start the program. But it's not consistent, sometimes I get it sometimes I don't. The first few lines of the stack trace read:
Exception in thread "AWT-EventQueue-0" java.lang.NullPointerException
at org.jzy3d.plot3d.rendering.view.Renderer3d.init(Renderer3d.java:60)
at jogamp.opengl.GLDrawableHelper.init(GLDrawableHelper.java:155)
at jogamp.opengl.GLDrawableHelper.init(GLDrawableHelper.java:175)
at javax.media.opengl.awt.GLJPanel$Updater.init(GLJPanel.java:662)
at jogamp.opengl.GLDrawableHelper.init(GLDrawableHelper.java:155)
at jogamp.opengl.GLDrawableHelper.init(GLDrawableHelper.java:175)
at jogamp.opengl.GLPbufferImpl$InitAction.run(GLPbufferImpl.java:281)
at jogamp.opengl.GLDrawableHelper.invokeGL(GLDrawableHelper.java:356)
at jogamp.opengl.GLPbufferImpl.invokeGL(GLPbufferImpl.java:274)
at jogamp.opengl.GLPbufferImpl.display(GLPbufferImpl.java:147)
at javax.media.opengl.awt.GLJPanel$PbufferBackend.doPaintComponentImpl(GLJPanel.java:1227)
at javax.media.opengl.awt.GLJPanel$AbstractReadbackBackend.doPaintComponent(GLJPanel.java:996)
at javax.media.opengl.awt.GLJPanel.paintComponent(GLJPanel.java:384)
2) When using "awt" (which is actually much faster than "swing" when resizing a panel), I get an error when initiating a mouse drag on the plot if it's currently rotating. The stack trace begins with:
Exception in thread "Embedded by ChartThreadController" javax.media.opengl.GLException: java.lang.InterruptedException
at jogamp.opengl.awt.AWTThreadingPlugin.invokeOnOpenGLThread(AWTThreadingPlugin.java:100)
at jogamp.opengl.ThreadingImpl.invokeOnOpenGLThread(ThreadingImpl.java:197)
at javax.media.opengl.Threading.invokeOnOpenGLThread(Threading.java:164)
at javax.media.opengl.awt.GLCanvas.maybeDoSingleThreadedWorkaround(GLCanvas.java:767)
at javax.media.opengl.awt.GLCanvas.display(GLCanvas.java:388)
at org.jzy3d.plot3d.rendering.canvas.CanvasAWT.forceRepaint(CanvasAWT.java:89)
at org.jzy3d.plot3d.rendering.view.View.shoot(View.java:118)
at org.jzy3d.plot3d.rendering.view.View.setViewPoint(View.java:216)
at org.jzy3d.plot3d.rendering.view.View.rotate(View.java:132)
at org.jzy3d.chart.controllers.ChartCameraController.rotate(ChartCameraController.java:23)
at org.jzy3d.chart.controllers.thread.ChartThreadController.run(ChartThreadController.java:52)
Hopefully those make sense to you? Anyway, I must say, this is one AWESOME library! I very much appreciate the hard work you've put into creating this!
Rhizomorph
Scott Davis
Aug 24, 2011, 11:06:30 PM8/24/11
to jz...@googlegroups.com
Specifically, it has to do with polygon shading
Sorry, I meant "smoothing", not shading.
Martin Pernollet
Aug 25, 2011, 3:47:12 AM8/25/11
to jz...@googlegroups.com
Hi Scott,
Thanks for sharing your changes!
I confirm Quality(true, true, true, true, true, true, false); is a good way for solving your problem.
You may also disable alpha and use Quality.Intermediate. It also desactivate smooth points, smooth lines, etc. Which makes rendering really faster this way, and that may be the reason why you feel some slowlyness compared to 0.8 (in the 0.8 demo, the chart uses default quality, which is "intermediate")
When using sample buffer true/false or changing the number of buffers for antialiasing, I just can see bold axis lines, but that's all. What is your intent with that?
By the way, I would be pleased to look at your paper to see how jzy3d looks inside :)
I have some ideas concerning the exception, and will look at them later. Don't hesitate to send me an email if you don't see updates!
Cheers,
Martin
2011/8/25 Scott Davis <neural....@gmail.com>
Scott Davis
Aug 25, 2011, 9:03:27 AM8/25/11
to jz...@googlegroups.com
When using sample buffer true/false or changing the number of buffers for antialiasing, I just can see bold axis lines, but that's all. What is your intent with that?
There are a couple of other ways to rid of those jagged black outlines simply by change the Quality value alone, however they both have drawbacks:
- Set alphaActivated to false. This removes the black outlines, but the points still aren't as smooth, and the axis become very jagged.
- Set depthActivated to false. This removes the black outlines AND gives me very smooth points, but not my depth is all screwed up.
That being said, it actually would be nice to have the option give points an outline color, but only if the outline was smooth and was drawn for every point (as opposed to just some random points, as is the case here).
Martin Pernollet
Aug 25, 2011, 9:13:05 AM8/25/11
to jz...@googlegroups.com
2011/8/25 Scott Davis <neural....@gmail.com>
Perhaps there is a difference in how our video cards are reflecting this change in setting?
Right: my video card does not make a difference as the one shown by your screenshots.
Your feedback was very instructive, thank you very much for all your explanations!
Reply all
Reply to author
Forward
0 new messages