jp@gc - Graphs Generator 1.3.1 - Question about Results in Graphic Generation
406 views
Skip to first unread message

74j...@gmail.com
Dec 17, 2015, 10:36:48 AM12/17/15
to jmeter-plugins
Hey,


Started to do offline load testing and deployed "jp@gc - Graphs Generator" as suggested per "https://www.ubik-ingenierie.com/blog/automatically-generating-nice-graphs-at-end-of-your-load-test-with-apache-jmeter-and-jmeter-plugins/".
Liked that jp@gc Plugins in online mode but found a couple of doubts and issues with the generated results.
Thanks for reading this.
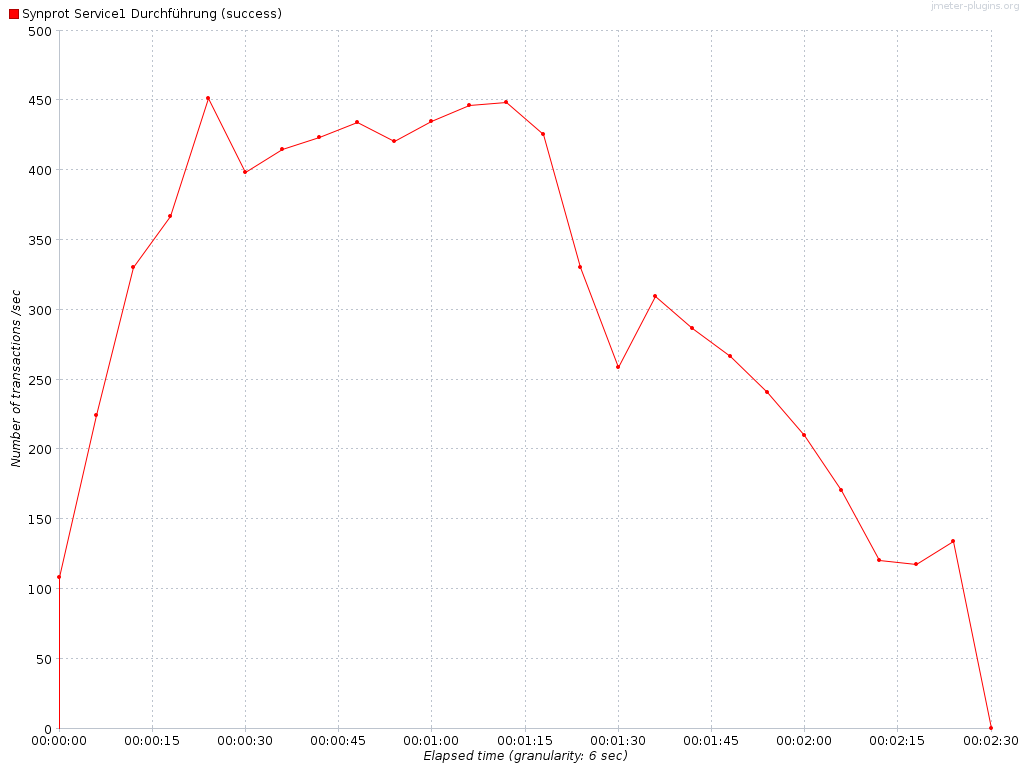
#1 Number of Transactions per Seconds - Granulation setting.
Calculating from the numbers in jmeter.log the transactions per seconds must be maxed around 400/s. I experienced that dependening on the Granulation setting the Number of Transactions per Seconds become doubtful. This behaviour applies to all other Graphics that have a "per sec" calculation e.g. ResponseCodesPerSecond.
#1.1 Number of Transactions per Seconds with 6000 Granulation setting.
#1.2 Number of Transactions per Seconds with 1000 Granulation setting.
#1.3 Number of Transactions per Seconds with 600 Granulation setting.
#1.3 Number of Transactions per Seconds with 100 Granulation setting.
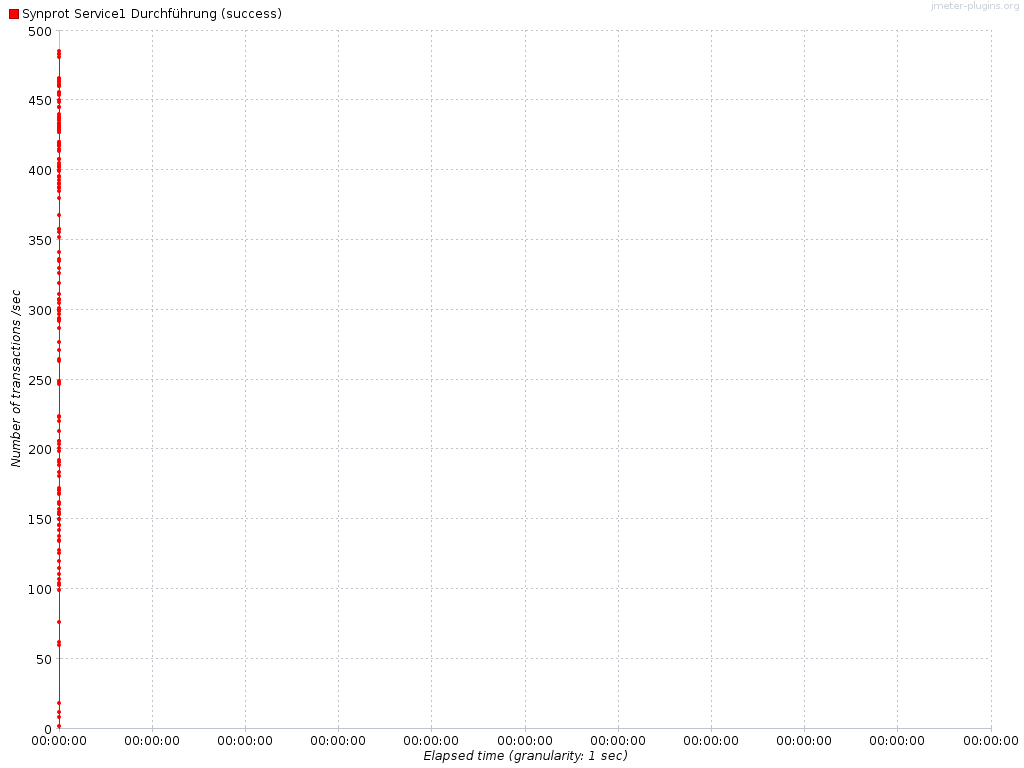
#2 Number of Transactions per Seconds - Prevent outliers setting
You'll see immediately what's possibly wrong.
#3 Number of Transactions per Seconds - Shared Granulation setting between "Transactions in Seconds" and "Response Time Distribution"
Having 1000ms Granulation setting for Transactions in Seconds is too coarse for "Response Time Distribution", which i like to have per 100ms.
#4 Setting "Aggregate all rows into one: True" gives
2015/12/17 16:34:23 WARN - jmeter.engine.StandardJMeterEngine: Error encountered during shutdown of kg.apc.jmeter.listener.GraphsGeneratorListener@38555d74 java.lang.UnsupportedOperationException: Seems you've requested aggregate mode for graph that don't support it. We apologize...
at kg.apc.jmeter.graphs.AbstractGraphPanelVisualizer.switchModel(AbstractGraphPanelVisualizer.java:377)
at kg.apc.jmeter.PluginsCMDWorker.setOptions(PluginsCMDWorker.java:252)
at kg.apc.jmeter.PluginsCMDWorker.doJob(PluginsCMDWorker.java:196)
at kg.apc.jmeter.listener.GraphsGeneratorListener.testEnded(GraphsGeneratorListener.java:222)
at kg.apc.jmeter.listener.GraphsGeneratorListener.testEnded(GraphsGeneratorListener.java:137)
at org.apache.jmeter.engine.StandardJMeterEngine.notifyTestListenersOfEnd(StandardJMeterEngine.java:226)
at org.apache.jmeter.engine.StandardJMeterEngine.run(StandardJMeterEngine.java:448)
at java.lang.Thread.run(Thread.java:745)

Danijel Vukovič
Jan 3, 2016, 2:29:02 PM1/3/16
to jmeter-plugins, 74j...@gmail.com
Pictures
1.1, 1.2 ,1.3 Transactions per second, greater value has granulation, bigger jumps are on graph.
Important data for you is deviation, how is calculated and and what is
http://nico.vahlas.eu/2010/03/30/some-thoughts-on-stress-testing-web-applications-with-jmeter-part-2/
"The standard deviation (σ) measures the mean distance of the values to their average (μ). In other words it gives us a good idea of the dispersion or variability of the measures to their mean value".
Picture .1.3 Response times
Greater response times have impact on transactions per second.
Test starts with is rum up to load all threads, load thread in seconds and then rump down.
Picture 2
it TPS should be in elapse time not all in 0. hmmm i do not have a clue,..
Picture 3
Some of graphs what i saw do not support all arguments, i do not use this type of graph.
Try with this graph generator:
http://performancewebautoamtionother.blogspot.si/2015/12/jmeter-create-graphs-with-cmdrunner.html
this run from powershell CRMRunner graph.
Dne četrtek, 17. december 2015 16.36.48 UTC+1 je oseba 74j...@gmail.com napisala:
Reply all
Reply to author
Forward
0 new messages