Skip to first unread message

emra...@gmail.com
Jan 6, 2016, 10:06:32 AM1/6/16
to iNaturalist

And here's the 2010 populations density, by county:
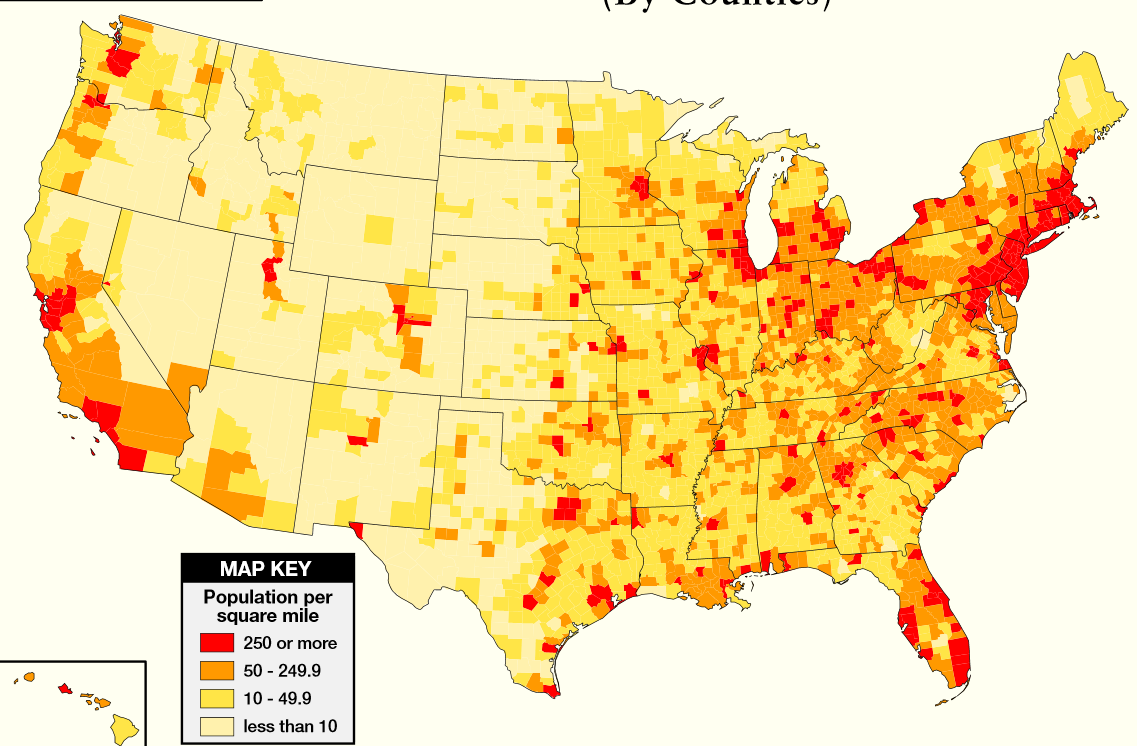
What patterns do you see? One that jumped out at me is the high density of observations around the northwest corner of Wyoming, which is not a densely populated area. Population density misses a key factor: tourist density. Lots of people making observations while visiting Yellowstone National Park (and maybe also Grand Teton National Park). Are there other patterns? Perhaps there is a correlation between observation density & biodiversity (at least of relatively charismatic taxa)? A correlation with major routes of travel? At an earlier time California was probably over-represented (due to it being the home of iNaturalist, and an area of early adoption), but it seems like that may no longer be as much of a factor.

Carrie Seltzer
Jan 6, 2016, 11:25:33 AM1/6/16
to iNaturalist
Oooh I love this! Cool, Evan! Here's the same US map with heat map colors (from http://www.inaturalist.org/observations/map#6/35.873/-91.015).
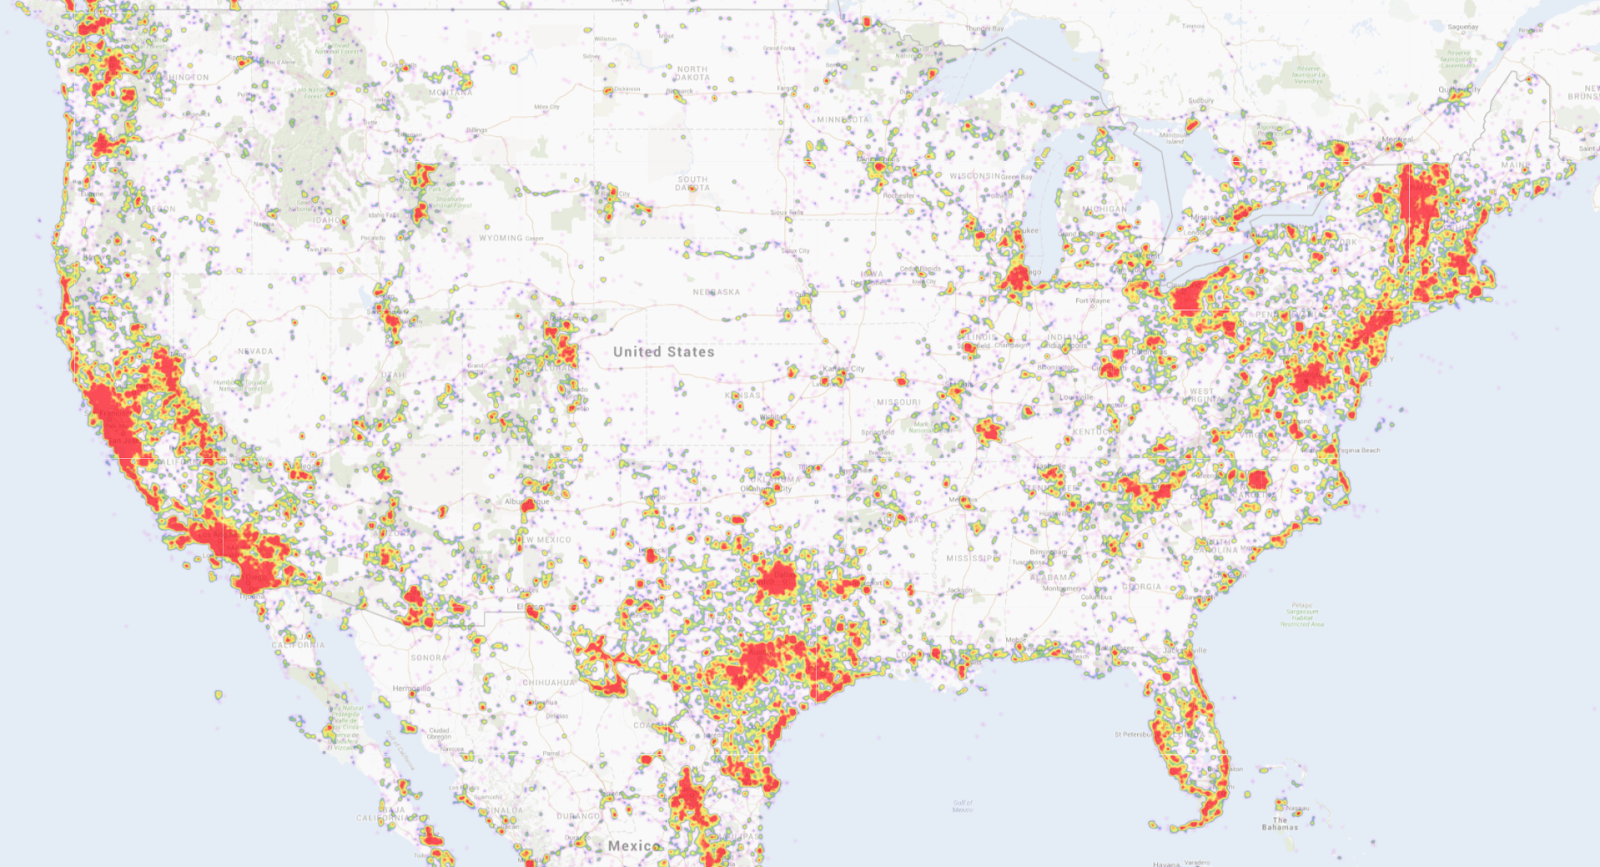
Some hotspots that jump out are Vermont and Texas (all of Vermont and even some very low pop density areas of TX)--major testament to the statewide efforts there!
Coldspots (less iNat activity than pop density might predict) include parts of the midwest, especially Indiana and Michigan.
Anyone with more GIS skills want to map the iNat observation:population ratio at the county level for the whole US? :-)
Carrie

Charlie Hohn
Jan 6, 2016, 11:33:49 AM1/6/16
to inatu...@googlegroups.com
I love it! Especially how Vermont pops out. Parts of Ohio have a good showing too, and the Northwest is getting there..
California people, you need to get out to the southern San Joaquin Valley and central coast range. I know a lot of that is biologically desolate due to factory farms, etc, but there are gems hiding out there for sure. Also the Modoc Plateau. And here in Vermont we need to get out to that northwestern corner at some point, it's relatively underrepresented.
Whoever did that road trip across the whole Plains etc puts mine to shame. i think they may have been biking and recording roadkill... what a great contribution. We need more of those. Also more of the Red Desert of Wyoming, and of Nevada. So sad I did not have iNat when i was doing field work out there, and took very few photos. I got all over the state back then.
Whoever did that road trip across the whole Plains etc puts mine to shame. i think they may have been biking and recording roadkill... what a great contribution. We need more of those. Also more of the Red Desert of Wyoming, and of Nevada. So sad I did not have iNat when i was doing field work out there, and took very few photos. I got all over the state back then.
--
You received this message because you are subscribed to the Google Groups "iNaturalist" group.
To unsubscribe from this group and stop receiving emails from it, send an email to inaturalist...@googlegroups.com.
To post to this group, send email to inatu...@googlegroups.com.
Visit this group at https://groups.google.com/group/inaturalist.
For more options, visit https://groups.google.com/d/optout.
============================
Charlie Hohn
Montpelier, Vermont
Charlie Hohn
Montpelier, Vermont

Christopher Tracey
Jan 6, 2016, 11:36:55 AM1/6/16
to inatu...@googlegroups.com
> On Jan 6, 2016, at 11:25 AM, Carrie Seltzer <carrie...@gmail.com> wrote;
> Anyone with more GIS skills want to map the iNat observation:population ratio at the county level for the whole US? :-)
>
>
Yes, but time is lacking today. ;)>
>
Charlie Hohn
Jan 6, 2016, 11:39:37 AM1/6/16
to inatu...@googlegroups.com
also is there a way to see the heatmap without obscured observations? Not that they aren't good valid observations but they make squares that hide the patterns.
--
You received this message because you are subscribed to the Google Groups "iNaturalist" group.
To unsubscribe from this group and stop receiving emails from it, send an email to inaturalist...@googlegroups.com.
To post to this group, send email to inatu...@googlegroups.com.
Visit this group at https://groups.google.com/group/inaturalist.
For more options, visit https://groups.google.com/d/optout.
emra...@gmail.com
Jan 8, 2016, 8:09:23 AM1/8/16
to iNaturalist
Thanks for adding the heat map, Carrie - I had forgotten about that option, and it's a much better view. I could probably do the GIS work, but it would require downloading all iNat observations from the contiguous US, and last time I tried to download a huge batch like that it caused an issue for the developers. Maybe that has changed? Maybe they could extract a simplified heat map/density raster that I could use, rather than my trying to create my own from all individual observations? For ease of comparison it would probably be best to get observations/square mile by county (or at least # observations by county, and I could do the calculation), since that's generally what you get with census data.
Christopher Tracey
Jan 8, 2016, 12:50:51 PM1/8/16
to inatu...@googlegroups.com
Evan,

I downloaded the ~650k research grade observation for the US and compared it to a population density map (from 2000, the only data I could find). A simple correlation stat between the two layers shows an overall correlation of 0.2534.
I did normalize each layer to range from 0-1 and then multiplied them together to try to visualize where there was strong overlap and got a map that looked like this:
Anything that is not gray shows some positive relationship. I'm not sure I'm doing this correctly, so any advice is welcome.
I can share the files if anyone wants them.
-Chris
Carrie Seltzer
Jan 8, 2016, 2:00:09 PM1/8/16
to iNaturalist
Not related to population density but related to sampling effort, I stumbled across this paper today:
It provides a way to use raw presence-only (e.g. iNaturalist) data to generate ignorance maps that use other observations within the same taxonomic group as a proxy for sampling effort. Nice little paper and I'd love to see if anyone uses this! Perhaps plants in Vermont or herps in Texas :-)
Carrie
--
You received this message because you are subscribed to a topic in the Google Groups "iNaturalist" group.
To unsubscribe from this topic, visit https://groups.google.com/d/topic/inaturalist/2R37zYr5bEY/unsubscribe.
To unsubscribe from this group and all its topics, send an email to inaturalist...@googlegroups.com.
To post to this group, send email to inatu...@googlegroups.com.
Visit this group at https://groups.google.com/group/inaturalist.
For more options, visit https://groups.google.com/d/optout.

Kyle Copas
Jan 8, 2016, 4:19:03 PM1/8/16
to inatu...@googlegroups.com
The Ruete paper is quite interesting—we had him down to Copenhagen several weeks ago to present to the 'GBIF data users club'.
It's one of 19 such papers (I think) turned up through our task group on fitness-for-use for SDM. We're set to push a consultation draft out into the broader community early next week. Anyone interested in a sneak preview? It's not exclusive to iNat (as Carrie's i.e. suggests), but very much related to this topic:
Happy weekend reading.
Kyle
Carrie Seltzer
Jan 8, 2016, 4:54:37 PM1/8/16
to iNaturalist
Thanks, for sharing that, Kyle. I'll take a look. I found the Biodiversity Data Journal from the GBIF newsletter. Anyone else who nerds out on this kind of thing can sign up for their newsletter here (http://www.gbif.org/newsroom/summary#signup) for a bimonthly dose of GBits.
Carrie
Charlie Hohn
Jan 8, 2016, 5:02:41 PM1/8/16
to inatu...@googlegroups.com
Very neat Chris, it sure shows which people are documenting urban nature... and seems to match my perception of iNaturalist activity. But what about a reverse correlation - places where the per capita iNaturalist use is either high or low? That could show a whole other angle to this. Or maybe I just want to see Vermont light up on the map :)
Evan Raskin
Jan 8, 2016, 5:20:37 PM1/8/16
to inatu...@googlegroups.com
Nice. I think we could use all observations for this though – get a larger dataset. Not like the non-research-grade observations are going to be less geospatially accurate, on average. I’ll think about this next week & see if I can come up with some other ways to fiddle with the data.

Ken-ichi
Jan 11, 2016, 8:17:01 PM1/11/16
to inaturalist
When I think about correlations like this I mostly see the digital
divide. The inland areas of the deep south have population density,
great biodiversity, but no observations. Degree of open space seems
commensurate with Texas, so it's hard to blame it on that. Definitely
less institutional engagement than in TX, so there's some contingency,
but I suspect a lot is driven by fewer people with the time and money
to spend on natural history. Compare with the county-level income data
at http://www.census.gov/censusexplorer/censusexplorer.html and you'll
see a lot of similarities to our data gaps: deep south, New Mexico,
South Dakota. If you actually did this seriously and controlled for
population density, and maybe proximity to popular parks, I bet income
would have a lot of explanatory power. There could also be a racial /
ethnic component, given that non-white people tend to be
disproportionately absent from many outdoors activities. For
qualitative comparison
http://demographics.coopercenter.org/DotMap/index.html is useful here,
but it's based on census data so in theory one could run the numbers.
Reply all
Reply to author
Forward
0 new messages