Skip to first unread message

Fred Shaw
Apr 6, 2017, 2:17:48 PM4/6/17
to igv-help
I have a BED file like
chr1 23768 24500 10
chr1 30000 35000 5
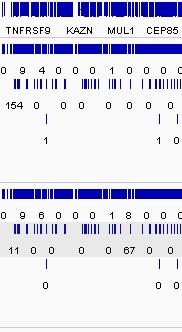
The last column has copy counts. When I load this BED file into IGV. It shows the numbers in the last column as numbers (10. 5, etc.). Is there anyway to show them as bars in a bar chart, like the bar chart for gene expression data? But this file is not gene expression file, just some count.
Thanks,
Fred

James Robinson
Apr 6, 2017, 2:34:32 PM4/6/17
to igv-help
You need to use a "bedgraph" file, in "bed" format the 4th column is the feature name. This is as simple as renaming the extension go "bedgraph" to indicate the format.
--
---
You received this message because you are subscribed to the Google Groups "igv-help" group.
To unsubscribe from this group and stop receiving emails from it, send an email to igv-help+unsubscribe@googlegroups.com.
To view this discussion on the web visit https://groups.google.com/d/msgid/igv-help/1296c1c2-9ea0-44ff-b2b0-a875debd2fa8%40googlegroups.com.
For more options, visit https://groups.google.com/d/optout.
Fred Shaw
Apr 6, 2017, 2:45:16 PM4/6/17
to igv-help
Hi Jim,
Worked! Thank you.
One more question, is there a way for me to add all count numbers in 0.5 million base intervals into 1 number and display them in bar chart?
Thanks,
Fred
Worked! Thank you.
One more question, is there a way for me to add all count numbers in 0.5 million base intervals into 1 number and display them in bar chart?
Thanks,
Fred
On Thursday, April 6, 2017 at 2:34:32 PM UTC-4, Jim Robinson wrote:
You need to use a "bedgraph" file, in "bed" format the 4th column is the feature name. This is as simple as renaming the extension go "bedgraph" to indicate the format.
On Thu, Apr 6, 2017 at 2:17 PM, Fred Shaw <fredn...@gmail.com> wrote:
I have a BED file likechr1 23768 24500 10chr1 30000 35000 5The last column has copy counts. When I load this BED file into IGV. It shows the numbers in the last column as numbers (10. 5, etc.). Is there anyway to show them as bars in a bar chart, like the bar chart for gene expression data? But this file is not gene expression file, just some count.Thanks,Fred
--
---
You received this message because you are subscribed to the Google Groups "igv-help" group.
To unsubscribe from this group and stop receiving emails from it, send an email to igv-help+u...@googlegroups.com.
James Robinson
Apr 6, 2017, 2:53:46 PM4/6/17
to igv-help
Not in IGV, you would need to write a script to compute that.
To unsubscribe from this group and stop receiving emails from it, send an email to igv-help+unsubscribe@googlegroups.com.
To view this discussion on the web visit https://groups.google.com/d/msgid/igv-help/cd398997-df25-4103-bad1-677d69fd249f%40googlegroups.com.
Fred Shaw
Apr 6, 2017, 3:00:38 PM4/6/17
to igv-help
Thanks.
Reply all
Reply to author
Forward
0 new messages