sample info related features/ navigating many tracks
25 views
Skip to first unread message

Matthias
Nov 10, 2016, 11:20:11 AM11/10/16
to igv-help
Dear IGV support group,
I am a user of IGV, and I first would like to thank you for the time and effort you put in developing and maintaining this tool. I contact the support group because I have a question about IGV features. I would like to know what features IGV has to address a recurrent use case in my lab, which is the navigation of a lot of track.
For example, in a somewhat common example of current experimental setups, we would have 10 different biological targets (e.g. transcription factors) at 5 different times in 2 different tissues which makes it 50 to 100 signal (reads pileup) tracks, after merging biological and technical replicates. The number doubles (or more) if you add some further analysis tracks (e.g. peak calling tracks, generated with different parameters like the minimum FDR threshold). And of course to complete the information stack you want to visualise those alongside consensus datasets from other projects and studies. This more and more frequent setup raises different issues concerning efficient track navigation and a fruitful visualisation analysis. What features does IGV already implements to address this and ease the navigation of such stacks ?
To be more precise, I have seen that it is possible to add sample information which allow grouping of tracks, etc. (see sampleinfo-igv.png)
However, unless I did not understand correctly, it does not appears to be fully functional.
A thing that work as expected is selection by attribute by clicking on the colored cell. Another one is the grouping per single attribute using the dialog.
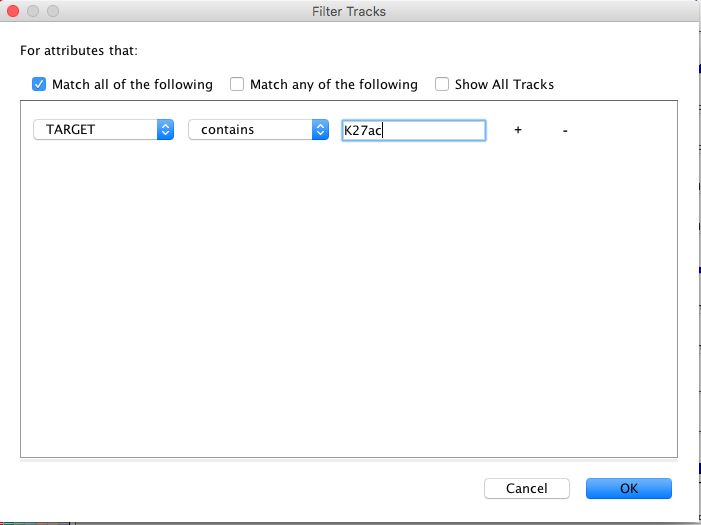
On the contrary, if I have an attribute column TARGET that contains either "X" or "Y", when I try to filter by "starting by" or "is equal to" and use X as a value (see filtering-dialog-igv.png), it does not seem to do anything. The same goes for ordering using one, or more than one attribute either by clicking on the sample information's column name or using the dedicated dialog: If i try to order by time then target, I obtain an order that is not good (see ordering-dialog-igv.png and ordering-result-igv.png).
Briefly, I'd like some precision on those features. Are they fully functional, or am I misunderstanding their usage? Do you have other proposal on how to handle so many tracks for efficient visualisation ?
Thank you for your help and best regards,
Matthias.

James Robinson
Nov 10, 2016, 1:45:32 PM11/10/16
to igv-help
The features should be fully functional. You did not specify the IGV version you are using, could you check using "Help > About" and let us know?
Its hard for me to determine exactly what you have done from the screenshots. You say that "A thing that work as expected is selection by attribute by clicking on the colored cell. Another one is the grouping per single attribute using the dialog.". I want to confirm that these features work. Is that correct?
With respect to the filter option that should work. Could you attach the sample information file used for this case? Don't copy/paste it, the whitespace will be lost which is important. Just attach the file.
If you are able it would be helpful if you could open separate git issues for each problem, assuming there is more than one, if possible with example files to reproduce the problem. I realize this might be difficult with as many files as you have, but at a minimum the sample information file should be attached. Issues can be filed here: https://github.com/igvteam/igv/issues.
--
---
You received this message because you are subscribed to the Google Groups "igv-help" group.
To unsubscribe from this group and stop receiving emails from it, send an email to igv-help+unsubscribe@googlegroups.com.
To view this discussion on the web visit https://groups.google.com/d/msgid/igv-help/f9097491-90a5-4fc0-80a2-699a43a74c90%40googlegroups.com.
For more options, visit https://groups.google.com/d/optout.
Matthias
Nov 11, 2016, 9:29:11 AM11/11/16
to igv-help
Dear Jim,
Thanks for your answer,
I use the latest IGV desktop release 2.3.88
I confirm that I can select all tracks sharing a common attribute by clicking on one of the sample information cell.
I also confirm that I can group tracks sharing a common attribute by going to the grouping dialog (Tracks > Group tracks...)
A subset sample file is attached to the message.
I won't open issues on github yet, I'll wait to know if I am misusing the tools first.
Thanks for your help
M.
To unsubscribe from this group and stop receiving emails from it, send an email to igv-help+u...@googlegroups.com.
James Robinson
Nov 14, 2016, 6:05:07 PM11/14/16
to igv-help
Hi,
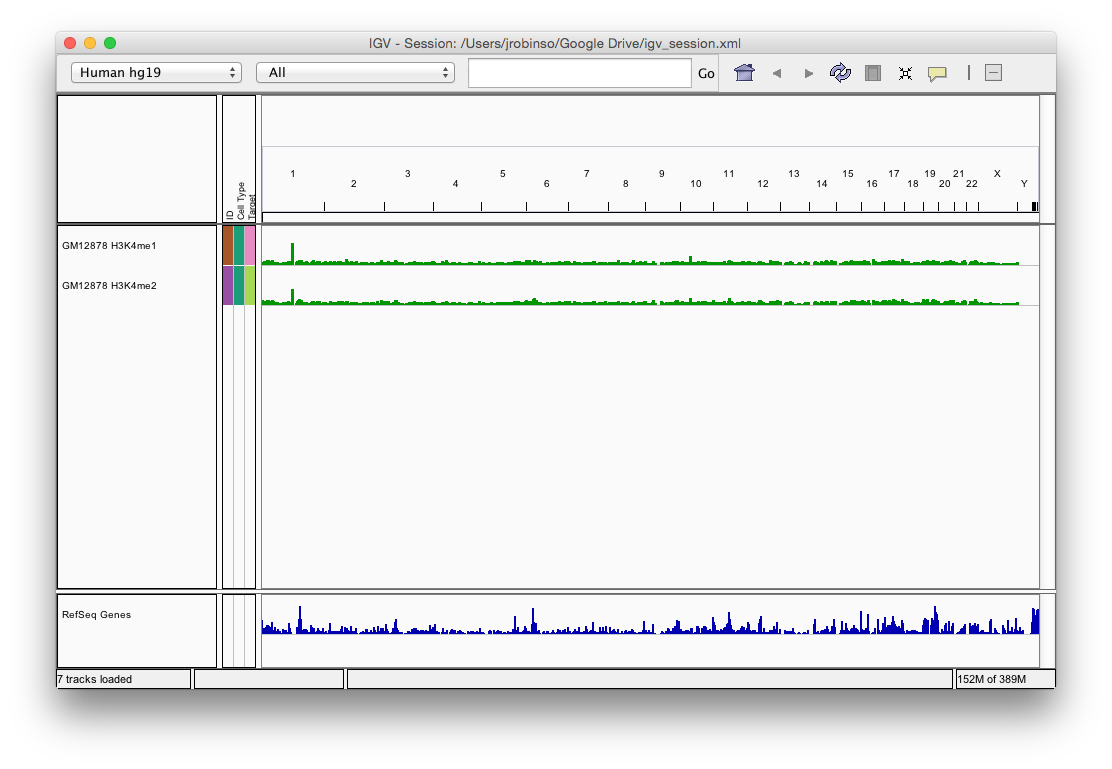
The sample-info file looks normal. I can't try it directly as I don't have those files, so I tried to simulate your situation with server hosted encode files. If you load the attached igv_session.xml (File > Open Session) and select "Tracks > Filter" then "Target starts with H3K4 you should end up with 2 tracks showing, H3K4me1 and H3K4me2 (see screenshot).
I'm attaching the sample info file and another session file without the sample info reference. If you can edit this sample info file and reproduce your issue with the referenced encode tracks I will be happy to look at it. Just load the file after loading the "no sampleinfo" session. I can't do much without some way to reproduce what you're seeing.
Jim

Matthias
Nov 16, 2016, 5:44:36 AM11/16/16
to igv-help
Dear Jim,
Thanks for your time.
So I tried your session, and ,indeed, filtering works as intended.
How's the mapping done between between the sample info file and the loaded data files ? Is there a preferential way to do it, like having a column complete_file_path or else ?
Cheers,
M
James Robinson
Nov 16, 2016, 3:03:24 PM11/16/16
to igv-help
Hi Matthias,
The first column can be either the full path to the file, or the track name (the name you see in the leftmost panel). With some file formats you can explicitly set a track name, for example with at track line, but in other cases the name is derived from the file path. However if you don't control the name explicitly its probably better to use the path.
--
---
You received this message because you are subscribed to the Google Groups "igv-help" group.
To unsubscribe from this group and stop receiving emails from it, send an email to igv-help+unsubscribe@googlegroups.com.
To view this discussion on the web visit https://groups.google.com/d/msgid/igv-help/e9442f46-80fb-47dc-b8cd-72dc2acb6098%40googlegroups.com.
Reply all
Reply to author
Forward
0 new messages