Chrome extension resources have longer stall time for published extension compared to local extension
708 views
Skip to first unread message

Jenny
Aug 16, 2017, 1:40:46 AM8/16/17
to Google Chrome Developer Tools
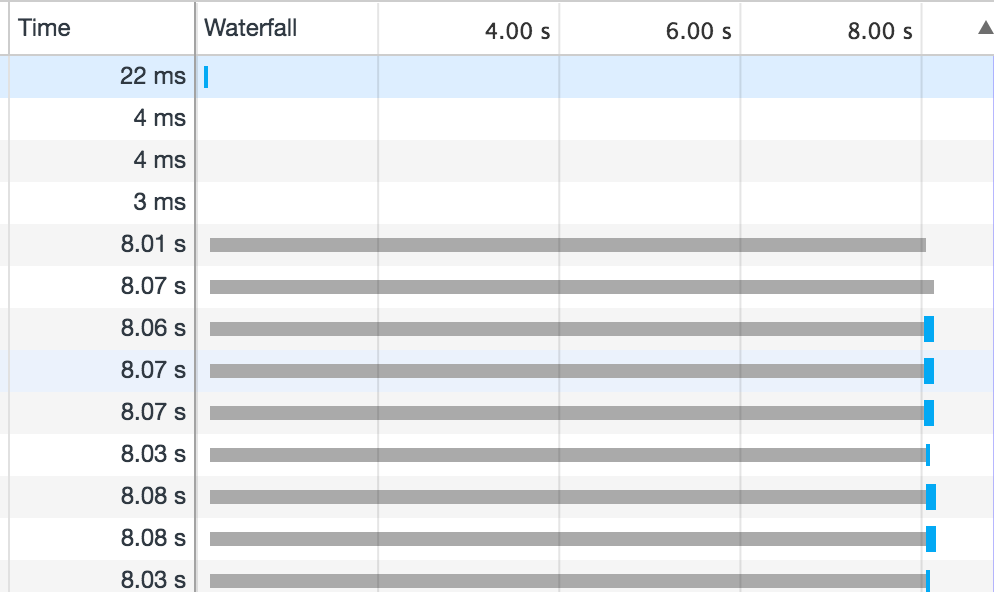
I am developing a chrome extension that opens files within the extension, so all requests are client-side. When I upload my local chrome extension in developer mode, the stall time of resources (like css, javascript, image tags) loaded from the extension's opened html page is significantly shorter than the same version published to the Chrome web store (around 60 ms as opposed to 7 seconds). These resources are all stalling at the same time right after sending a request for the html page. This means that the page takes way too long to load. Why would the same extension behave differently when run locally vs from the web store?
When looking at the timing, the lag is coming from the "Stalled" phase at the start of the connection. It says here that this occurs when there are higher priority requests, there are already six TCP connections open for this origin, and the browser is briefly allocating space in the disk cache. For the first option, I don't think this is the case because the files are stalling right after loading the html page and are high priority. For the second option, it isn't stalling six resources at a time, but rather stalling all resources initiated by the html page at once (around 15 files). Maybe it has to do with the third option?
I would appreciate any help as I am new to this type of development. Thanks!

PhistucK
Aug 16, 2017, 1:52:24 AM8/16/17
to Google Chrome Developer Tools
While it is a Developer Tools feature question, it is not really about it (you want to know why things are slow, basically), but apparently about a browser issue. :(
I do not think it is the disk cache, just because I would expect extensions not to be cached (they are already on the disk, caching already local content does not make sense). But maybe.
Two things you can try -
- Go to chrome://net-internals and watch the Events tab for requests related to your extension. Then go to your extension page, wait for it to finish loading and go over the chrome://net-internals entries. It sometimes shows user readable statuses.
- Go to chrome://tracing, start the trace, go to your extension page, wait for it to finish and stop the chrome://tracing trace. Go over things there and see if there is a long function call.
Anyway, unless you drive is extremely busy in the WebStore originated extension case (perhaps the unpacked extension is on a less busy drive?), this sounds like a bug.
You can search crbug.com for an existing issue and star it. If you cannot find one, file a new issue using the "New issue" link on the same page.
Please, do not add a "+1" or "Me too" or "Confirmed" (or similar) comment. It just wastes the time of Chrome engineers and sends unnecessary e-mails to all of the people who starred the issue.
You can reply with a link to the found or created issue and might get triaged (and fixed) faster.
Thank you.
☆PhistucK
--
You received this message because you are subscribed to the Google Groups "Google Chrome Developer Tools" group.
To unsubscribe from this group and stop receiving emails from it, send an email to google-chrome-developer-tools+unsub...@googlegroups.com.
To view this discussion on the web visit https://groups.google.com/d/msgid/google-chrome-developer-tools/b324c9d2-cccd-4348-a9cb-dcf2ab72d1d2%40googlegroups.com.
For more options, visit https://groups.google.com/d/optout.
Reply all
Reply to author
Forward
0 new messages