Understanding the retaining tree with a leak
1,475 views
Skip to first unread message

allan....@gmail.com
Jun 16, 2014, 9:20:50 AM6/16/14
to google-chrome-...@googlegroups.com
Hello all,
I'm having a bit of trouble understanding the retaining tree in an attempt to track down a leak that is present in my JS library and I was wondering if someone might be able to point me in the right direction.
This is the page I'm working on to try and track down the leak: http://datatables.net/dev/memory/ . When you click on the blue "link" text it creates a table and then destroys it and should result is no additional memory - but there, so there is a leak.
I understand the retaining tree showing the structure it is (since its showing my nested data), but I can't for the life of me figure out what is hanging on to the created data structures and causing the leak. For example, in "Containment" view in the detached DOM tree, there are a number of elements that I created which haven't been GC'd. But I don't see what is clinging on to them, and they are all red, which I thought meant they weren't reachable from JS?
I feel like there is something (a closure likely) clinging on to the main object for the table that just needs to be snipped, but I can't see what.
Any thoughts or suggestions are very welcome indeed!
Thanks,
Allan

Yury Semikhatsky
Jun 17, 2014, 8:02:31 AM6/17/14
to Google Chrome Developer Tools
On Mon, Jun 16, 2014 at 5:20 PM, <allan....@gmail.com> wrote:
Hello all,I'm having a bit of trouble understanding the retaining tree in an attempt to track down a leak that is present in my JS library and I was wondering if someone might be able to point me in the right direction.This is the page I'm working on to try and track down the leak: http://datatables.net/dev/memory/ . When you click on the blue "link" text it creates a table and then destroys it and should result is no additional memory - but there, so there is a leak.I understand the retaining tree showing the structure it is (since its showing my nested data), but I can't for the life of me figure out what is hanging on to the created data structures and causing the leak. For example, in "Containment" view in the detached DOM tree, there are a number of elements that I created which haven't been GC'd. But I don't see what is clinging on to them, and they are all red, which I thought meant they weren't reachable from JS?
I see two HTMLDivElements in a detached DOM tree and they are referenced by some closure variables (see screenshot), e.g. function @104485 on the screenshot references Array b which contains one of the DIV elements. I have no clue why this path is not cleared and whether it should be (it might be that jQuery caches something) this way. I see lots of new wrappers created for DOM tree elements which were accessed first time from the script and they are OK as they are created on the first access to element.
I feel like there is something (a closure likely) clinging on to the main object for the table that just needs to be snipped, but I can't see what.
Do you see any objects in the diff which should definitely not be there?
Any thoughts or suggestions are very welcome indeed!Thanks,Allan
--
You received this message because you are subscribed to the Google Groups "Google Chrome Developer Tools" group.
To unsubscribe from this group and stop receiving emails from it, send an email to google-chrome-develo...@googlegroups.com.
To view this discussion on the web visit https://groups.google.com/d/msgid/google-chrome-developer-tools/5868d690-45a2-4ac9-900b-c121498d74ab%40googlegroups.com.
For more options, visit https://groups.google.com/d/optout.
allan....@gmail.com
Jun 17, 2014, 10:41:13 AM6/17/14
to google-chrome-...@googlegroups.com
Hi,
Thanks so much for your reply. That does look like a jQuery cache, which suggests there might not be a leak there after all?
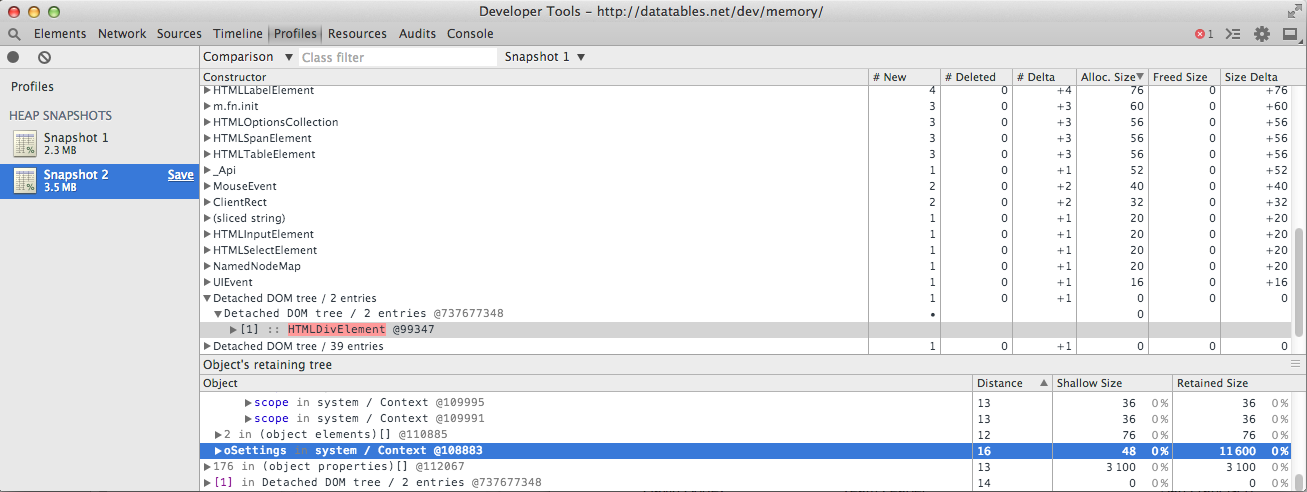
I've updated my example to include the original code I was debugging, which I'm fairly certain has a leak in it - I had tried to simplify the code before... The attached image shows an object which is attached to a property called `oSettings`. What I'd really like to know is what is retaining that `oSettings` property. All links to it should be cut, so its descendant properties such as this detached DOM node would be GC'ed. At the moment they are retained. Is there a way I can find out what is retaining that property?
Thanks,
Allan
Yury Semikhatsky
Jun 17, 2014, 10:58:33 AM6/17/14
to Google Chrome Developer Tools
On Tue, Jun 17, 2014 at 6:41 PM, <allan....@gmail.com> wrote:
Hi,Thanks so much for your reply. That does look like a jQuery cache, which suggests there might not be a leak there after all?I've updated my example to include the original code I was debugging, which I'm fairly certain has a leak in it - I had tried to simplify the code before... The attached image shows an object which is attached to a property called `oSettings`. What I'd really like to know is what is retaining that `oSettings` property. All links to it should be cut, so its descendant properties such as this detached DOM node would be GC'ed. At the moment they are retained. Is there a way I can find out what is retaining that property?
The general approach is to look at retainers of the object you think is leaking and start eliminating them one by one starting from the one with the shortest distance to the global object (Distance field). You should break those retaining paths at some point, I cannot tell which one exactly as I'm not familiar with your application. Once shortest retaining path is eliminated the object will either become collectable or you'll find another retainer. I hope this helps.
Thanks,Allan
On Tuesday, 17 June 2014 13:02:31 UTC+1, Yury Semikhatsky wrote:On Mon, Jun 16, 2014 at 5:20 PM, <allan....@gmail.com> wrote:
Hello all,I'm having a bit of trouble understanding the retaining tree in an attempt to track down a leak that is present in my JS library and I was wondering if someone might be able to point me in the right direction.This is the page I'm working on to try and track down the leak: http://datatables.net/dev/memory/ . When you click on the blue "link" text it creates a table and then destroys it and should result is no additional memory - but there, so there is a leak.I understand the retaining tree showing the structure it is (since its showing my nested data), but I can't for the life of me figure out what is hanging on to the created data structures and causing the leak. For example, in "Containment" view in the detached DOM tree, there are a number of elements that I created which haven't been GC'd. But I don't see what is clinging on to them, and they are all red, which I thought meant they weren't reachable from JS?I see two HTMLDivElements in a detached DOM tree and they are referenced by some closure variables (see screenshot), e.g. function @104485 on the screenshot references Array b which contains one of the DIV elements. I have no clue why this path is not cleared and whether it should be (it might be that jQuery caches something) this way. I see lots of new wrappers created for DOM tree elements which were accessed first time from the script and they are OK as they are created on the first access to element.I feel like there is something (a closure likely) clinging on to the main object for the table that just needs to be snipped, but I can't see what.Do you see any objects in the diff which should definitely not be there?Any thoughts or suggestions are very welcome indeed!Thanks,Allan
--
You received this message because you are subscribed to the Google Groups "Google Chrome Developer Tools" group.
To unsubscribe from this group and stop receiving emails from it, send an email to google-chrome-develo...@googlegroups.com.
To view this discussion on the web visit https://groups.google.com/d/msgid/google-chrome-developer-tools/3cd70c48-35c8-4383-bde4-d0ec47a9cf81%40googlegroups.com.

Ilya Tikhonovsky
Jun 17, 2014, 12:52:22 PM6/17/14
to google-chrome-...@googlegroups.com
There is a simple way to understand is it a leak or not.
You just need to use Record Heap Allocation profile type.
I've recorded a small video that shows the process for a question on stackoverflow about a 'leak' in jQuery
The idea is to start profiler, repeat the action a few times and stop profiler. If the blue bars related to the time of the action became grey then there were no leaks at that moment (ie all the object that were allocated at that moment were released by the end of recording).
It is a kind of normal situation when a framework or even v8 caches the results of the last action in its internal structures. So the bar for the last action is blue.
To unsubscribe from this group and stop receiving emails from it, send an email to google-chrome-developer-tools+unsub...@googlegroups.com.
To view this discussion on the web visit https://groups.google.com/d/msgid/google-chrome-developer-tools/3cd70c48-35c8-4383-bde4-d0ec47a9cf81%40googlegroups.com.
--
You received this message because you are subscribed to the Google Groups "Google Chrome Developer Tools" group.
To unsubscribe from this group and stop receiving emails from it, send an email to google-chrome-developer-tools+unsub...@googlegroups.com.
To view this discussion on the web visit https://groups.google.com/d/msgid/google-chrome-developer-tools/CANpOREWnrP8-Vhm9i%3D9T2-yAC1oLG5JafnZbLX0A6muHxxQjOg%40mail.gmail.com.
allan....@gmail.com
Jun 18, 2014, 5:07:59 AM6/18/14
to google-chrome-...@googlegroups.com
Hi,
Thank you so much to both of you for your help here - it has been very instructive! Using the "Record Heap Allocation" profile it would appear that I don't have a leak after all... Once the cache for V8 and jQuery have settled down each create and destroy cycle has no additional elements remaining on the tree from this view. Certainly if I put an intentional leak in, it is very clear in the record heap allocation.
There are, now and then, additional items added to the heap during the create and destroy cycle that aren't being released (in the image attached) - I presume V8 has some kind of predictive memory allocation so that it will cache additional items that weren't cached the first time?
Many thanks!
Allan
Yury Semikhatsky
Jun 18, 2014, 5:45:57 AM6/18/14
to Google Chrome Developer Tools
On Wed, Jun 18, 2014 at 1:07 PM, <allan....@gmail.com> wrote:
Hi,Thank you so much to both of you for your help here - it has been very instructive! Using the "Record Heap Allocation" profile it would appear that I don't have a leak after all... Once the cache for V8 and jQuery have settled down each create and destroy cycle has no additional elements remaining on the tree from this view. Certainly if I put an intentional leak in, it is very clear in the record heap allocation.There are, now and then, additional items added to the heap during the create and destroy cycle that aren't being released (in the image attached) - I presume V8 has some kind of predictive memory allocation so that it will cache additional items that weren't cached the first time?
It may be that some functions were optimized which resulted in a new code being generated and you see it in the profile. Generally you should not worry about V8 internal data structures as V8 should be able to decide when to drop them automatically.
To view this discussion on the web visit https://groups.google.com/d/msgid/google-chrome-developer-tools/c7f3a71f-7a7f-4668-b1f3-7fe5895958d4%40googlegroups.com.To unsubscribe from this group and stop receiving emails from it, send an email to google-chrome-develo...@googlegroups.com.
Reply all
Reply to author
Forward
0 new messages