JS profiling AngularJS
45 views
Skip to first unread message

Mohan Radhakrishnan
Mar 22, 2015, 2:35:54 AM3/22/15
to google-chrome-...@googlegroups.com
Hi,
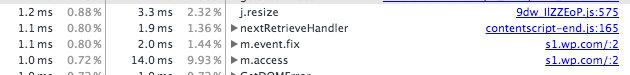
I started using the profilers because we have a big AngularJS application.I am particularly interested in flamegraphs to debug the AngularJS module loaders.I could locate the API calls in the graphs pertaining to the module loaders. Is there a way to collect the link between the module loader source code and the relevant callstack ?
I mean that I would like to generate a report that links the AngularJS module loader calls and the call stack ? I know I could parse the HAR report using R.
Are there other ways to do this ? How does one report the links between the callstack and source so that one can home in on the performance problem caused by too many unwanted calls of a particular kind ?
Thanks,
Mohan

Paul Irish
Mar 22, 2015, 2:46:47 AM3/22/15
to Google Chrome Developer Tools
How do the module loaders add the modules? eval/Function? <script> appends, etc?


Are the filenames you currently see in the profiler indicative of the module?
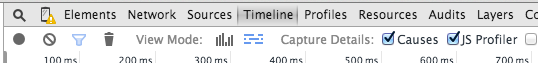
If so you can repeat the recording but instead with Timeline + JS profiler
After finishing recording you can right-click "Save Timeline Data".
This Timeline export JSON will include a URL for the various call stacks.
--
You received this message because you are subscribed to the Google Groups "Google Chrome Developer Tools" group.
To unsubscribe from this group and stop receiving emails from it, send an email to google-chrome-develo...@googlegroups.com.
To view this discussion on the web visit https://groups.google.com/d/msgid/google-chrome-developer-tools/84b8e7ff-9d1a-4dde-95f0-5d30b1d071a5%40googlegroups.com.
For more options, visit https://groups.google.com/d/optout.
Mohan Radhakrishnan
Mar 22, 2015, 7:56:34 AM3/22/15
to google-chrome-...@googlegroups.com
I will report back with a live callstack. I saw call indications that the module loader calls were in the stack. I couldn't find out how many modules were eagerly loaded. We were trying to reduce that with some type of lazy loading. I was looking at the flamegraph because the user code is loading too many AngularJS modules by calling AngularJS API.
Thanks.
On Sunday, 22 March 2015 12:16:47 UTC+5:30, Paul Irish wrote:
How do the module loaders add the modules? eval/Function? <script> appends, etc?Are the filenames you currently see in the profiler indicative of the module?If so you can repeat the recording but instead with Timeline + JS profilerAfter finishing recording you can right-click "Save Timeline Data".This Timeline export JSON will include a URL for the various call stacks.
On Sat, Mar 21, 2015 at 11:35 PM, Mohan Radhakrishnan <radhakris...@gmail.com> wrote:
Hi,I started using the profilers because we have a big AngularJS application.I am particularly interested in flamegraphs to debug the AngularJS module loaders.I could locate the API calls in the graphs pertaining to the module loaders. Is there a way to collect the link between the module loader source code and the relevant callstack ?I mean that I would like to generate a report that links the AngularJS module loader calls and the call stack ? I know I could parse the HAR report using R.Are there other ways to do this ? How does one report the links between the callstack and source so that one can home in on the performance problem caused by too many unwanted calls of a particular kind ?Thanks,Mohan
--
You received this message because you are subscribed to the Google Groups "Google Chrome Developer Tools" group.
To unsubscribe from this group and stop receiving emails from it, send an email to google-chrome-developer-tools+unsub...@googlegroups.com.
Reply all
Reply to author
Forward
0 new messages