Remote Debugging issue
192 views
Skip to first unread message

c.debel...@emixis.com
Dec 26, 2016, 6:42:16 AM12/26/16
to Google Chrome Developer Tools
I am working on an Ionic 2 app and trying to debugg it with Remote Debugging.
I am trying to use breakpoints but I have one problem. In the scope panel, the variables shown are the ones from the parent class of my the actual class I created. i.e: I have a breakpoint inside a function that is called when pushing a button and the variables appearing in the scope are the TouchEvent and PointerEvents objects of the handleTouchStart method, which of course aren't the ones I want to inspect.
The breakpoints are not referring to the classes I created but always to their parents.
I hope I am clear enough...
Thanks
Thanks

PhistucK
Dec 26, 2016, 6:44:45 AM12/26/16
to Google Chrome Developer Tools
Not very clear.
(I am not sure what Ionic means in terms of remote debugging and Chromium, though.)
Screenshots may help.
Are you debugging a web page?
Can you debug it using Chrome instead of Iconic? If so, does the problem reproduce?
☆PhistucK
--
You received this message because you are subscribed to the Google Groups "Google Chrome Developer Tools" group.
To unsubscribe from this group and stop receiving emails from it, send an email to google-chrome-developer-tools+unsub...@googlegroups.com.
To view this discussion on the web visit https://groups.google.com/d/msgid/google-chrome-developer-tools/3bcc1534-02a2-4d7e-9dd8-1ea799570c6a%40googlegroups.com.
For more options, visit https://groups.google.com/d/optout.
c.debel...@emixis.com
Dec 26, 2016, 9:22:56 AM12/26/16
to Google Chrome Developer Tools
The fact that the app I am coding is made with Ionic doesn't actually matter I guess.
I'm debugging a mobile app from my Android device with Chrome's Remote Debugging.
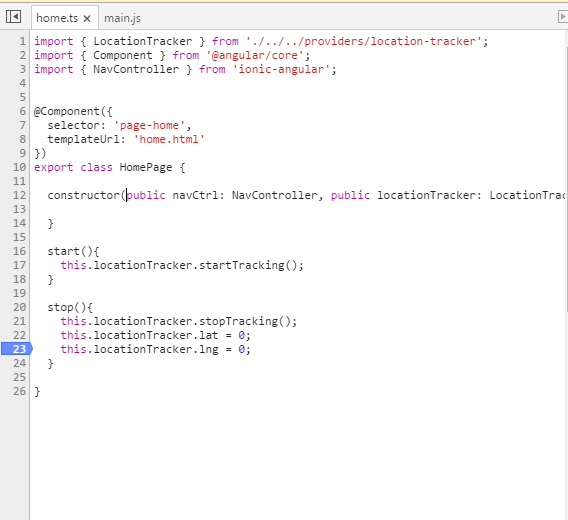
As shown in screenshot 1, I am placing a breakpoint in the stop() function, which is triggered when I am pushing a button in my app.
The purpose of this is simply to inspect the variables while calling this function (in this example, lat or lng).
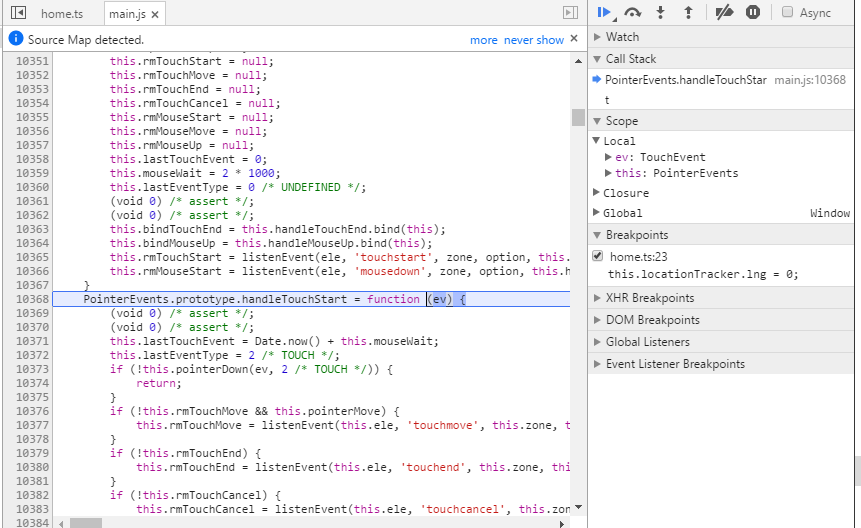
But screenshot 2 shows that instead of staying in my "home.ts" page and showing my variables in the Scope panel (right column), the debugger opens a "main.js" page and inspects the TouchEvent variables etc...
The purpose of this is simply to inspect the variables while calling this function (in this example, lat or lng).
But screenshot 2 shows that instead of staying in my "home.ts" page and showing my variables in the Scope panel (right column), the debugger opens a "main.js" page and inspects the TouchEvent variables etc...
Any idea why this happens ?
PhistucK
Dec 26, 2016, 11:36:32 AM12/26/16
to Google Chrome Developer Tools
Did you check one of the event types under the "Event Listener Breakpoints" drawer (screenshot 2, the last item in the right side)?
This is weird, because it does not say why it broke (it should say, "Paused on "click" event listener", or "Paused on a breakpoint" or something similar as it breaks, unless you step in, over, out and similar).
Can you reproduce with desktop Chrome?
You can search crbug.com for an existing issue and star it. If you cannot find one, file a new issue using the "New issue" link on the same page.
Please, do not add a "+1" or "Me too" or "Confirmed" (or similar) comment. It just wastes the time of Chrome engineers and sends unnecessary e-mails to all of the people who starred the issue.
You can reply with a link to the found or created issue and might get triaged (and fixed) faster.
Thank you.
☆PhistucK
To view this discussion on the web visit https://groups.google.com/d/msgid/google-chrome-developer-tools/fbe11f36-7135-4d5d-8cec-010c5ab0ecb4%40googlegroups.com.
c.debel...@emixis.com
Dec 27, 2016, 4:18:34 AM12/27/16
to Google Chrome Developer Tools
I did not check any event type.
What do you mean by reproduce with desktop Chrome ?
What do you mean by reproduce with desktop Chrome ?
I filed a new issue on crbug.com : https://bugs.chromium.org/p/chromium/issues/detail?id=677110
Thank you
PhistucK
Dec 27, 2016, 5:27:11 AM12/27/16
to Google Chrome Developer Tools
The issue you created does not have any sample code, so I would not expect it to be resolved or reproduced.
I mean, try to load the web page you are trying to debug, using desktop Chrome and not using remote debugging, but using the local Developer Tools for the local web page and see if your issue reproduces.
☆PhistucK
To view this discussion on the web visit https://groups.google.com/d/msgid/google-chrome-developer-tools/176c2d1c-409c-4a6e-b2fe-e64240849142%40googlegroups.com.
c.debel...@emixis.com
Dec 27, 2016, 9:05:29 AM12/27/16
to Google Chrome Developer Tools
I had the same issue using desktop Chrome instead of remote debugging. Is it possible that Chrome's debugger doesn't support typescript and therefore tries to find an equivalent to my code in javascript ?
Anyway, I decided to use another debugging method (a more adapted one).
Thank you for your time
Anyway, I decided to use another debugging method (a more adapted one).
Thank you for your time
PhistucK
Dec 27, 2016, 11:46:41 AM12/27/16
to Google Chrome Developer Tools
The Developer Tools feature does not natively support any language other than JavaScript.
It "simulates" (in a very loose sense of the word) support by reading the source maps that the JavaScript specifies and shows the originating code (TypeScript, in your case) instead of the resulting code (JavaScript).
Because of this, there are a few factors that could be at fault here. For example, perhaps the source map was not created correctly (off topic here), or the Developer Tools feature reads the source map incorrectly, or the debugger does not correctly map the code.
If you could add to the created issue, as little code as possible to reproduce the issue, the cause could be investigated and perhaps fixed (if it is not a source map creation issue). If the cause is determined to be a faulty source map, you can file an issue with whatever tool that created that source map (TypeScript, perhaps, unless you use other tools, like Uglify, or Closure Compiler and friends, in which case either one of them could be at fault, or it might be a configuration issue, in case of source map "chaining" - where one tool creates a source map that is being fed to another tool which changes the source map after its processing).
☆PhistucK
To view this discussion on the web visit https://groups.google.com/d/msgid/google-chrome-developer-tools/fd7b0f52-7256-4be2-afb8-2c8cc794c384%40googlegroups.com.
c.debel...@emixis.com
Dec 28, 2016, 3:33:59 AM12/28/16
to Google Chrome Developer Tools
Well to be honest I am completely new to this and don't even know what a source map is.
Moreover, the only piece code I can provide is the one shown in the screenshots...
Moreover, the only piece code I can provide is the one shown in the screenshots...
Reply all
Reply to author
Forward
0 new messages