How to quickly view what js code is assigned to a given element
39,625 views
Skip to first unread message

luisma...@gmail.com
Jan 15, 2013, 9:31:16 AM1/15/13
to google-chrome-...@googlegroups.com
Hello,
Is there a way, or an add-on to Chrome Developer Tools, to quickly view what callback function has been assigned to a given html element? It would be very helpful, instead of having to inspect the Sources tab. I know how to access from an element variable to its corresponding line in the Elements tab when debugging (the "reveal in elements panel" option in the context menu), but I'm not sure if the opposite is possible, that is, what if I want to know if a given element in the Elements tab has been attached any callback without the need for inspecting the Sources tab line by line? I'm speaking about unobtrusive javascript, of course (no attributes of js events in the html elements).

Yury Semikhatsky
Jan 15, 2013, 9:45:15 AM1/15/13
to luisma...@gmail.com, Google Chrome Developer Tools
Did you see "Event Listeners" section in the Elements panel which lists all event listeners for selected DOM node? Is it what you are looking for?
luisma...@gmail.com
Jan 15, 2013, 10:24:54 AM1/15/13
to google-chrome-...@googlegroups.com, luisma...@gmail.com, yu...@google.com
I was thinking on something like pop-up links to the scripts on the html code of the Elements panel.
Anyway, I didn't use the Event Listeners panel and it looks very helpful, but apparently there is a drawback. For instance, I have this code in my own scripts.js file (line 11):
11 $('#contact-me').click(function() {
If I click on the corresponding element in the Elements tab, it is displayed within the "click" dropdown list, but the linked javascript file is direclty the jQuery file: jquery-1.8.3.min.js:2
This doesn't help much in this case actually. I would like to get quick access to the file in which the callback has been assigned, or where the callback function is (in my case both are in the same location, which is like I said, line 11 and subsequents in scripts.js)

Brian Grinstead
Jan 15, 2013, 9:21:33 PM1/15/13
to google-chrome-...@googlegroups.com, luisma...@gmail.com, yu...@google.com
I've thought about the same thing regarding events bound with jQuery or other frameworks, and wrote a post detailing a solution that could possibly work. Basically, devtools could show the stack trace of when the event was bound: http://www.briangrinstead.com/blog/devtools-feature-request-show-stack-trace-in-event-listeners. Not really sure how possible this is to implement, but it would be useful!
Brian
Yury Semikhatsky
Jan 16, 2013, 9:02:51 AM1/16/13
to Brian Grinstead, Google Chrome Developer Tools, luisma...@gmail.com
On Wed, Jan 16, 2013 at 6:21 AM, Brian Grinstead <briangr...@gmail.com> wrote:
I've thought about the same thing regarding events bound with jQuery or other frameworks, and wrote a post detailing a solution that could possibly work. Basically, devtools could show the stack trace of when the event was bound: http://www.briangrinstead.com/blog/devtools-feature-request-show-stack-trace-in-event-listeners. Not really sure how possible this is to implement, but it would be useful!
DevTools don't provide any specific support for frameworks like jQuery. The solution described in the post would require capturing stack traces every time event listener is added. This may cause undesireable performance penalty. I think a slightly different solution can be implemented by adding special mode to jQuery in which it would collect stack traces for the places where event handlers are added and implementing a DevTools extension that would display those stack traces in the DevTools UI.
Brian Grinstead
Jan 16, 2013, 9:15:09 AM1/16/13
to Yury Semikhatsky, Google Chrome Developer Tools, luisma...@gmail.com
This feature would benefit more than jQuery users. Any DOM library is going to be using a wrapper function for event binding, and even if you aren't using a third party library it is likely that there is at least a separate function to bind DOM events (to handle cross browser compatibility). It would also be nice to see what triggered the event binding in the first place (even if you were using addEventListener directly).
Fair point on the performance. I figured that if it was already keeping track of the original file name / line # of the actual addEventListener call it wouldn't be too much more work to keep track of the calls leading up to it, but I just don't really know. Just trying to think of ways to make the 'event listeners' panel more useful.
Brian
luisma...@gmail.com
Jan 16, 2013, 1:20:29 PM1/16/13
to google-chrome-...@googlegroups.com, Yury Semikhatsky, luisma...@gmail.com
I support the idea to provide some way like Brian said to debug code made with jQuery, or any other framework like Mootools, Prototype, etc. In the end, how many people use raw javascript to code web applications? It would be insane unless it's something simple. The people use javascript frameworks. If this way the EventListener panel is useless (I don't need to know what jQuery is internally doing) it only makes sense either for simple projects or for crazy people (no offense, I mean in the best sense) who don't rely on a framework to code complex projects.
So I think what Brian said would be great. If it's very resource consuming, then a button to switch it off and free memory once you don't need it would be perfect.
Yury Semikhatsky
Jan 17, 2013, 7:10:14 AM1/17/13
to Brian Grinstead, Google Chrome Developer Tools, Luis MS
On Wed, Jan 16, 2013 at 6:15 PM, Brian Grinstead <briangr...@gmail.com> wrote:
This feature would benefit more than jQuery users. Any DOM library is going to be using a wrapper function for event binding, and even if you aren't using a third party library it is likely that there is at least a separate function to bind DOM events (to handle cross browser compatibility). It would also be nice to see what triggered the event binding in the first place (even if you were using addEventListener directly).Fair point on the performance. I figured that if it was already keeping track of the original file name / line # of the actual addEventListener call it wouldn't be too much more work to keep track of the calls leading up to it, but I just don't really know.
It doesn't keep track of the addEventListener call at the moment. We show location of the event handler function in the source code, not the place where addEventListener was called.

PhistucK
Jan 17, 2013, 1:11:15 PM1/17/13
to Yury Semikhatsky, Brian Grinstead, Google Chrome Developer Tools, Luis MS
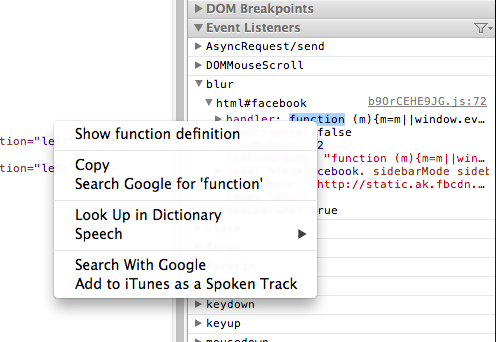
An extension that adds a "jQuery Events" drawer is attached.
(It is much like the regular "Event Listeners" drawer, but includes actual handlers added by jQuery, without the unhelpful abstraction.)
Right clicking on a function shows a "Show function definition" option that goes to the source of the handler function.
☆PhistucK
Yury Semikhatsky
Jan 18, 2013, 1:52:00 AM1/18/13
to PhistucK, Brian Grinstead, Google Chrome Developer Tools, Luis MS
There is a syntax error in the extension:
[24900:24900:0118/105119:ERROR:CONSOLE(34)] "Uncaught SyntaxError: Unexpected token }", source: chrome-extension://lappnpbkmofdmihaogoadojiajjkgfen/jquery-events.js (34)

Pavel Feldman
Jan 18, 2013, 3:53:08 AM1/18/13
to Yury Semikhatsky, PhistucK, Brian Grinstead, Google Chrome Developer Tools, Luis MS
We are working on putting expandable function object into the event listeners sidebar as well. You will be able to expand it and see all of its closure variables, including the actual handler that framework is wrapping.
Regards
Pavel
PhistucK
Jan 18, 2013, 6:29:49 AM1/18/13
to Pavel Feldman, Yury Semikhatsky, Brian Grinstead, Google Chrome Developer Tools, Luis MS
That sounds amazing. How are you going to do that generically (not only for jQuery)? create heuristics that determine whether a handler is actually a framework wrapper?
☆PhistucK
Pavel Feldman
Jan 18, 2013, 6:40:37 AM1/18/13
to PhistucK, Yury Semikhatsky, Brian Grinstead, Google Chrome Developer Tools, Luis MS
It will operate on function object and list all of its closures with their variables. This approach is framework-agnostic. It already works for functions dumped into the console. Just need to add them into the listeners sidebar.

dylanb...@gmail.com
Jan 27, 2013, 6:56:12 PM1/27/13
to google-chrome-...@googlegroups.com, Yury Semikhatsky, PhistucK, Brian Grinstead, Luis MS
Is there a way to get access to this information through the debugger API? I searched the documentation but could not find anything.
--Dylan
On Friday, January 18, 2013 11:47:47 AM UTC-5, Peter Rybin wrote:
On Friday, January 18, 2013 11:47:47 AM UTC-5, Peter Rybin wrote:
I added a bug on WebKit project:
dylanb...@gmail.com
Mar 15, 2013, 2:04:35 PM3/15/13
to google-chrome-...@googlegroups.com, Yury Semikhatsky, PhistucK, Brian Grinstead, Luis MS, dylanb...@gmail.com
crickets

Paul Irish
Mar 15, 2013, 5:28:30 PM3/15/13
to dylanb...@gmail.com, Google Chrome Developer Tools, Yury Semikhatsky, PhistucK, Brian Grinstead, Luis MS
Hi Luis,
This was implemented a few weeks ago: http://trac.webkit.org/changeset/142627
Dylan, you'll see the addition to the debugger protocol in inspector.json in the changeset.
Cheers.
crickets
--You received this message because you are subscribed to the Google Groups "Google Chrome Developer Tools" group.To unsubscribe from this group and stop receiving emails from it, send an email to google-chrome-develo...@googlegroups.com.

sexydev...@gmail.com
Mar 26, 2013, 5:10:13 PM3/26/13
to google-chrome-...@googlegroups.com, Paul Irish, Yury Semikhatsky, PhistucK, Brian Grinstead, Luis MS, dylanb...@gmail.com
@Paul I've installed the latest version of Chromium but I don't see a handler object, associated menu, or "Show function definition" menu choice.
Do I have to manually patch?
tyvm :^)

keithj...@gmail.com
Apr 25, 2013, 12:14:37 AM4/25/13
to google-chrome-...@googlegroups.com, sexydev...@gmail.com, Yury Semikhatsky, PhistucK, Brian Grinstead, Luis MS, Dylan Barrell
The "Show Function Definition" option does not display the function definition.
It still takes me into the event handling code within the jQuery library.
Is there a specific setting required? Chrome Canary v27.
tyvm
Keith ~kjm~

ma...@scottmwilliams.co.uk
May 7, 2013, 2:14:17 PM5/7/13
to google-chrome-...@googlegroups.com
I'm also wondering the same thing , which any event handlers I just end up in the jQuery source.

co...@dorning.me
Apr 16, 2014, 4:19:07 PM4/16/14
to google-chrome-...@googlegroups.com, luisma...@gmail.com
Any update on this? Still doesn't seem to exist.

avinash....@gmail.com
May 20, 2014, 10:53:57 AM5/20/14
to google-chrome-...@googlegroups.com, luisma...@gmail.com
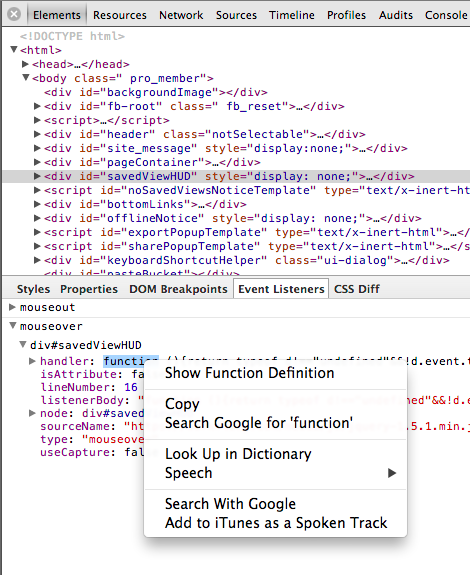
Hey. There doesn't seem to be a tool/option added specifically for this purpose, but there is a workaround for pages with jQuery < 1.10. Here's what I do. I first right-click the object in the view and select "Inspect element". This should highlight the element in the Elements tab in Chrome dev tools. I then head over to Console and type in "$._data($0)" (again...only works with jQuery loaded on the page). "$0" here refers to the current element. The function "$._data" returns an object that contains two properties, events & handler. Expand the "events" option to see all the events that have event handlers assigned. Expand over any of then and hover over the property "handler". It should show you something that looks like the attached screenshot. I think I had seen this in one of Paul Irish's awesome videos!! :-) Hope this helps.

Reply all
Reply to author
Forward
Message has been deleted
0 new messages