Better JavaScript debugging when multiple commands are on a single line
27 views
Skip to first unread message

Jeff
Apr 7, 2015, 12:47:22 PM4/7/15
to google-chrome-...@googlegroups.com
I have a minified 3rd party library that is causing some trouble. In the Source tab, I have already enabled Pretty Print for the library but unfortunately it doesn't make it pretty enough. Here is a line (my problem line!) that has been made "pretty."
e.easing = "string" == typeof e.easing && "undefined" != typeof jQuery && jQuery.isFunction(jQuery.easing[e.easing]) ? jQuery.easing[e.easing] : d.easing, "number" == typeof e.animate && (e.animate = {duration: e.animate,enabled: !0}), "boolean" != typeof e.animate || e.animate || (e.animate = {duration: 1e3,enabled: e.animate}), this.renderer = new e.renderer(a, e), this.renderer.draw(f), a.dataset && a.dataset.percent ? this.update(parseFloat(a.dataset.percent)) : a.getAttribute && a.getAttribute("data-percent") && this.update(parseFloat(a.getAttribute("data-percent")))There are still multiple commands on this single line of JavaScript and I have to hit the Step Over command several times before I can advance - all the while, the blue arrow indicator remains on this one same line. Consequently, it is difficult for me to determine which expression is about to be executed and what has just been executed.
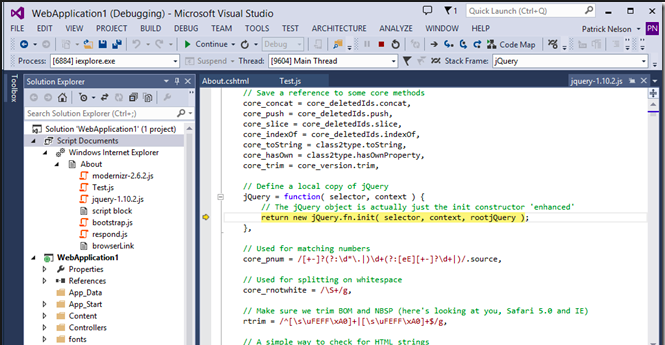
Ideally, I think that in these scenarios, instead of highlighting the entire line of code, Dev Tools would highlight only the expression that is about to be executed or at least highlight the expression differently from the rest of the line (light blue vs dark blue). Something like this mock-up:

Are other people running into this problem? Is this something that seems like it could make it into Dev Tools? If not, are there any extensions that do this?

Paul Irish
Apr 7, 2015, 1:05:05 PM4/7/15
to Google Chrome Developer Tools
I think there's two problems here
1. Our prettyprinter doesn't add linebreaks on commas, and as we know UglifyJS2 looooves commas. We're going to leverage V8 to help with the prettyprint which will resolve this.
2. We actually know the column position of the expression being stepped to, but dont' visualize anything beyond the entire line. I think it would help.
Visual studio highlights the expression, and while I'm not sure we end our highlight at the end of the expression, we can certainly start highlighting a line from a specific column position.
--
You received this message because you are subscribed to the Google Groups "Google Chrome Developer Tools" group.
To unsubscribe from this group and stop receiving emails from it, send an email to google-chrome-develo...@googlegroups.com.
To view this discussion on the web visit https://groups.google.com/d/msgid/google-chrome-developer-tools/17dd440e-1eef-4fed-981b-8f80d79290f4%40googlegroups.com.
For more options, visit https://groups.google.com/d/optout.

Andrey Lushnikov
Apr 7, 2015, 1:06:09 PM4/7/15
to google-chrome-...@googlegroups.com
FYI: feel free to star the bug about prettyprinter not putting linebreaks after commas https://code.google.com/p/chromium/issues/detail?id=383933
--
Jeff
Apr 7, 2015, 1:26:45 PM4/7/15
to google-chrome-...@googlegroups.com
Exactly. Resolving either one of those should be able help poor guys like me, but resolving both would go along way to debug these types of situations. My eyes go cross when I try to manually parse these expressions.

Jason Laster
Apr 7, 2015, 1:27:01 PM4/7/15
to google-chrome-...@googlegroups.com
I'm curious how much information we have about the expression being stepped into
I believe we have the start of the expression columnNumber, but i'm not sure if we have the expression itself. The function name is also funny because it's a fully resolved name and not necessarily the token in the source.
here's a sample of data returned from debugger.paused:
{"callFrameId": "{\"ordinal\":0,\"injectedScriptId\":2}",
  "functionName": "module.exports.Router.extend.index",
  "location": {
    "scriptId": "34",
    "lineNumber": 26642,
    "columnNumber": 23
}, "scopeChain
": []}
To view this discussion on the web visit https://groups.google.com/d/msgid/google-chrome-developer-tools/CAJZOyhx5%2BBiEWRMpM8J9ew%3DDTi%2BD5uwj5OXpU9%3D4Zp465Xo%3D9Q%40mail.gmail.com.
--
Jason Laster
Software Engineer
Etsy
Paul Irish
Apr 7, 2015, 4:45:01 PM4/7/15
to Google Chrome Developer Tools
Here's the ticket for #2: Issue 468428 - chromium - DevTools: revealPosition should reveal column number
To view this discussion on the web visit https://groups.google.com/d/msgid/google-chrome-developer-tools/CAH_2F5GLcJ8cD5f4Usi_NS8bRPsdh%2BsSPRfAoc1Yje%3D4iRRegA%40mail.gmail.com.
Reply all
Reply to author
Forward
0 new messages