How to interpret "Total Time" in Timeline panel "Group by Frame"?
453 views
Skip to first unread message

Grace Wang
Apr 19, 2017, 1:29:30 AM4/19/17
to Google Chrome Developer Tools
Hello!
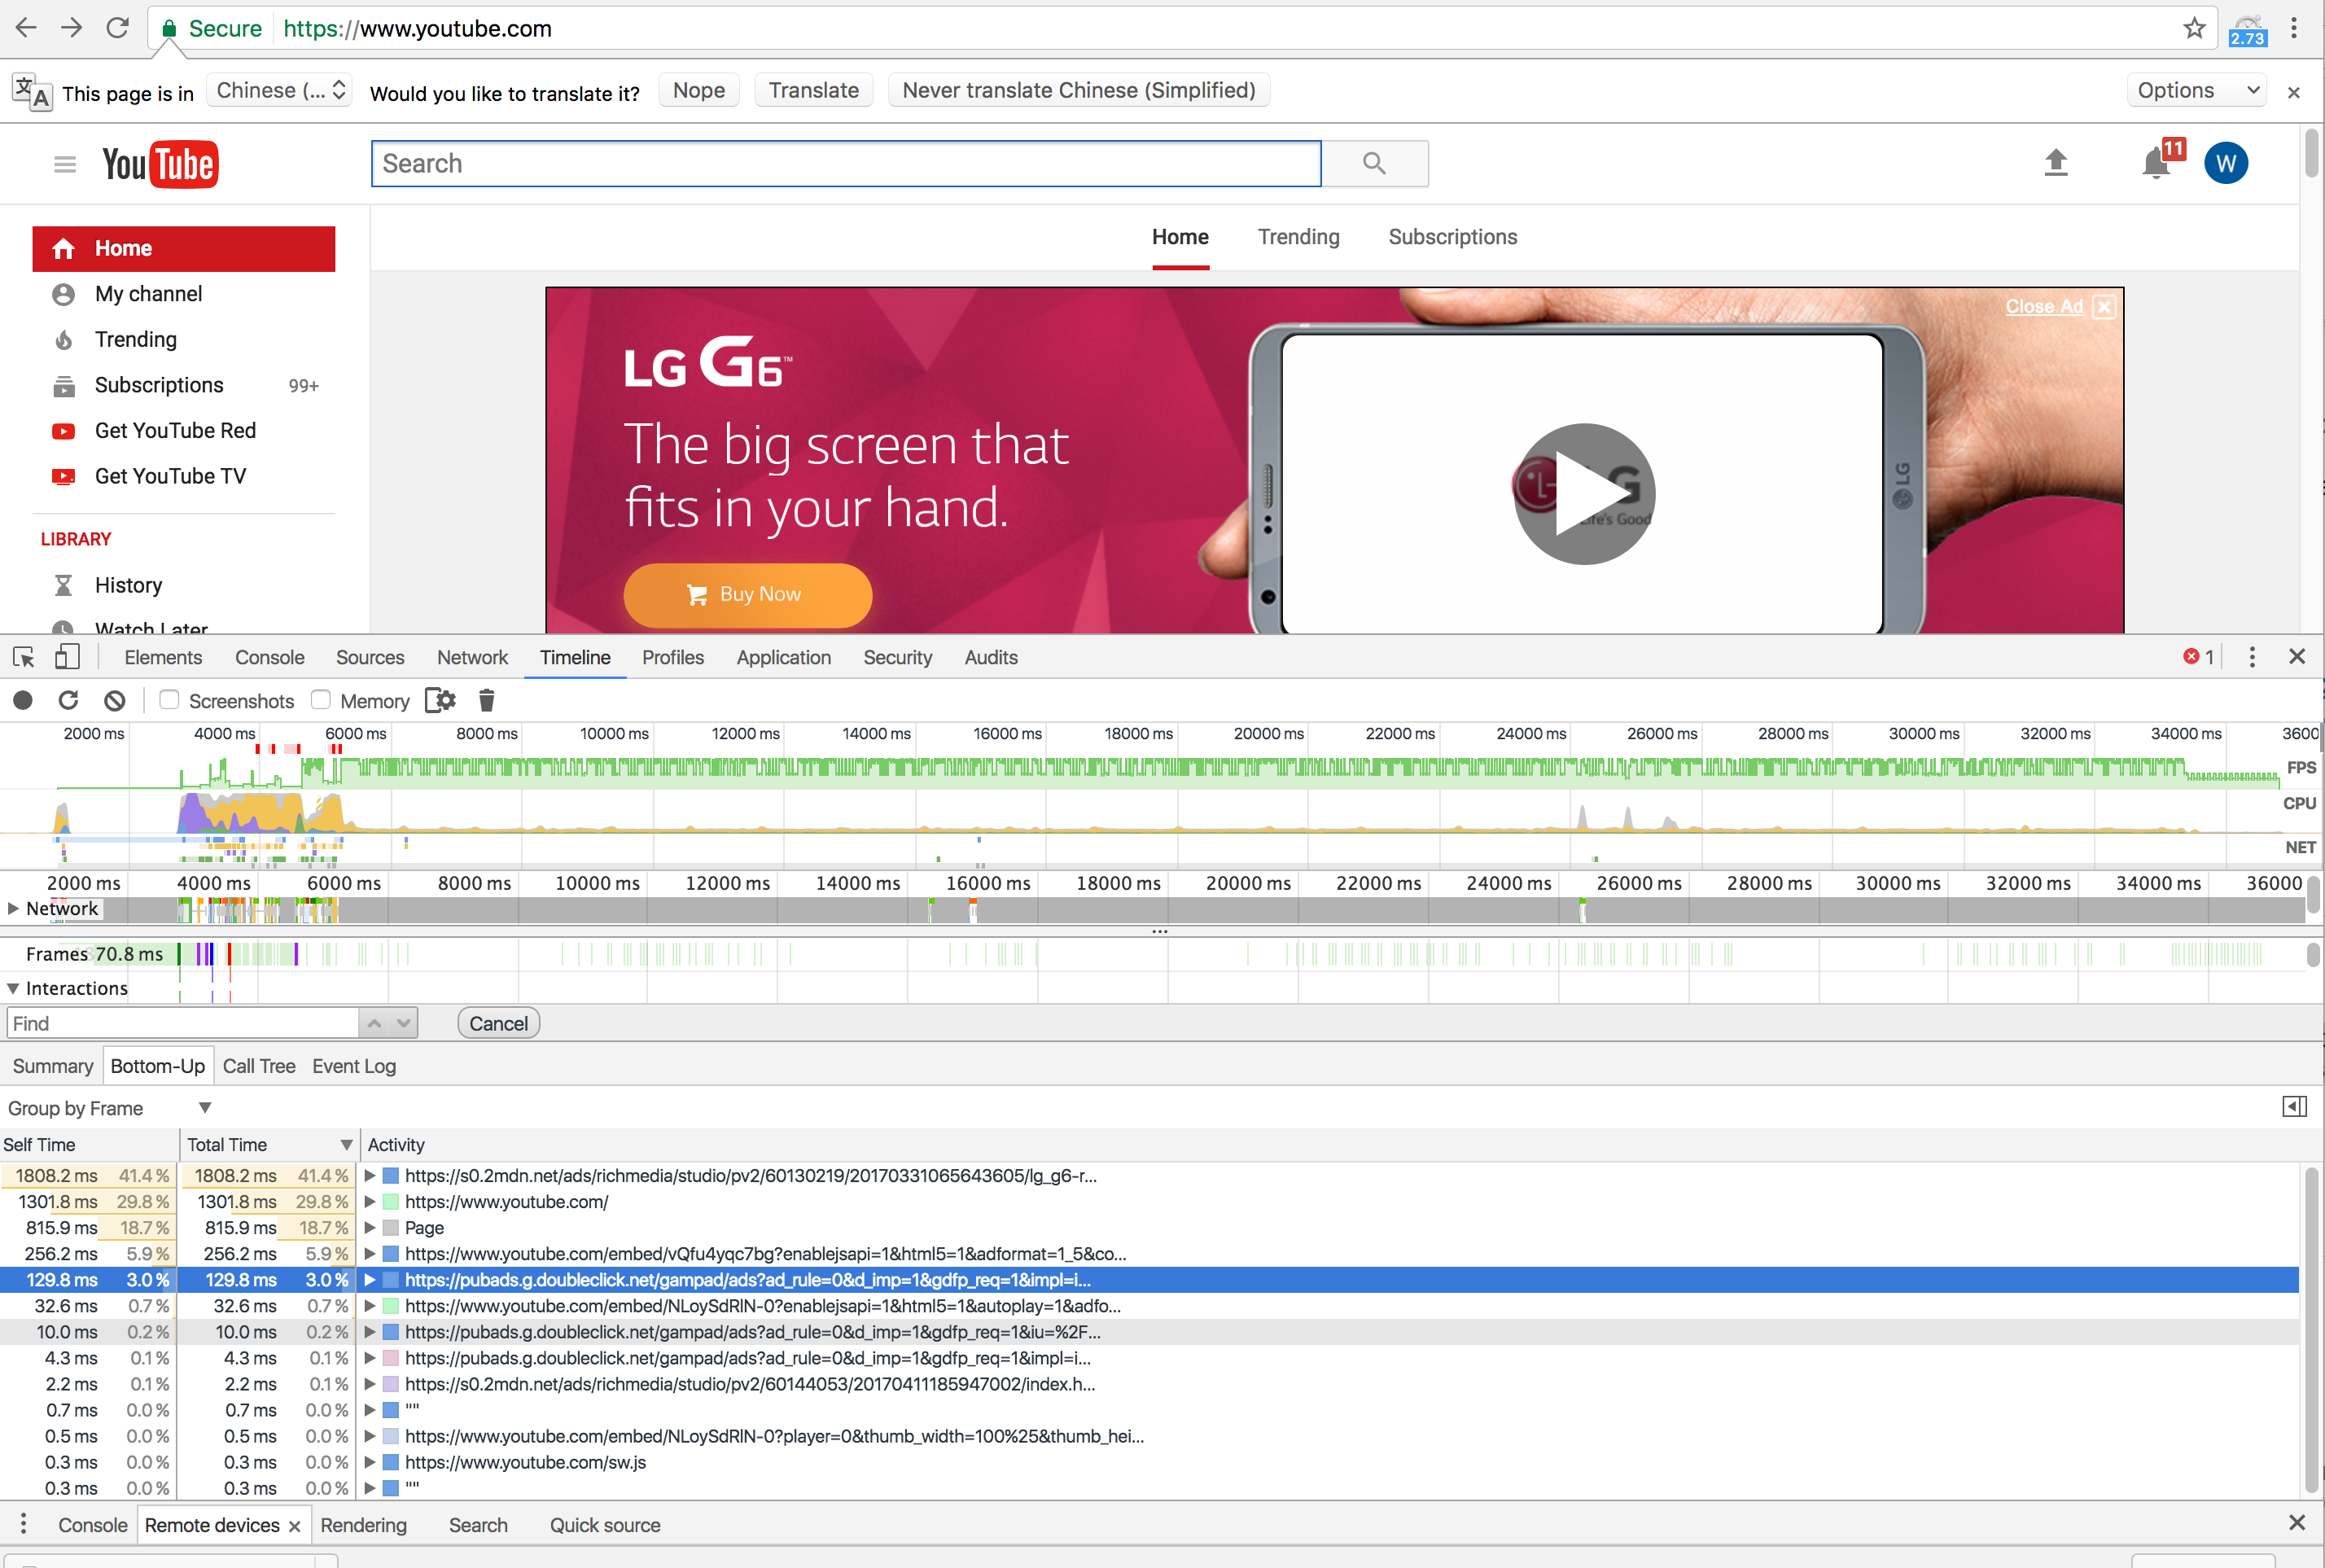
I took a recording for youtube.com (see attachments), and I am confused in interpreting the "Self Time" and "Total Time" when activities are grouped by frames ("Group by Frame" option) in "Bottom-up" and "Call Tree" tabs.
More specifically, when activities are grouped by frame, the "Total time" for each iframe is not the same in "Bottom-up" and "Call Tree" tabs. In "Bottom-up" tab, the activities related with frame "http://pubads.g.doubleclick.net..." takes:
Self Time: 129.8ms Total Time: 129.8ms
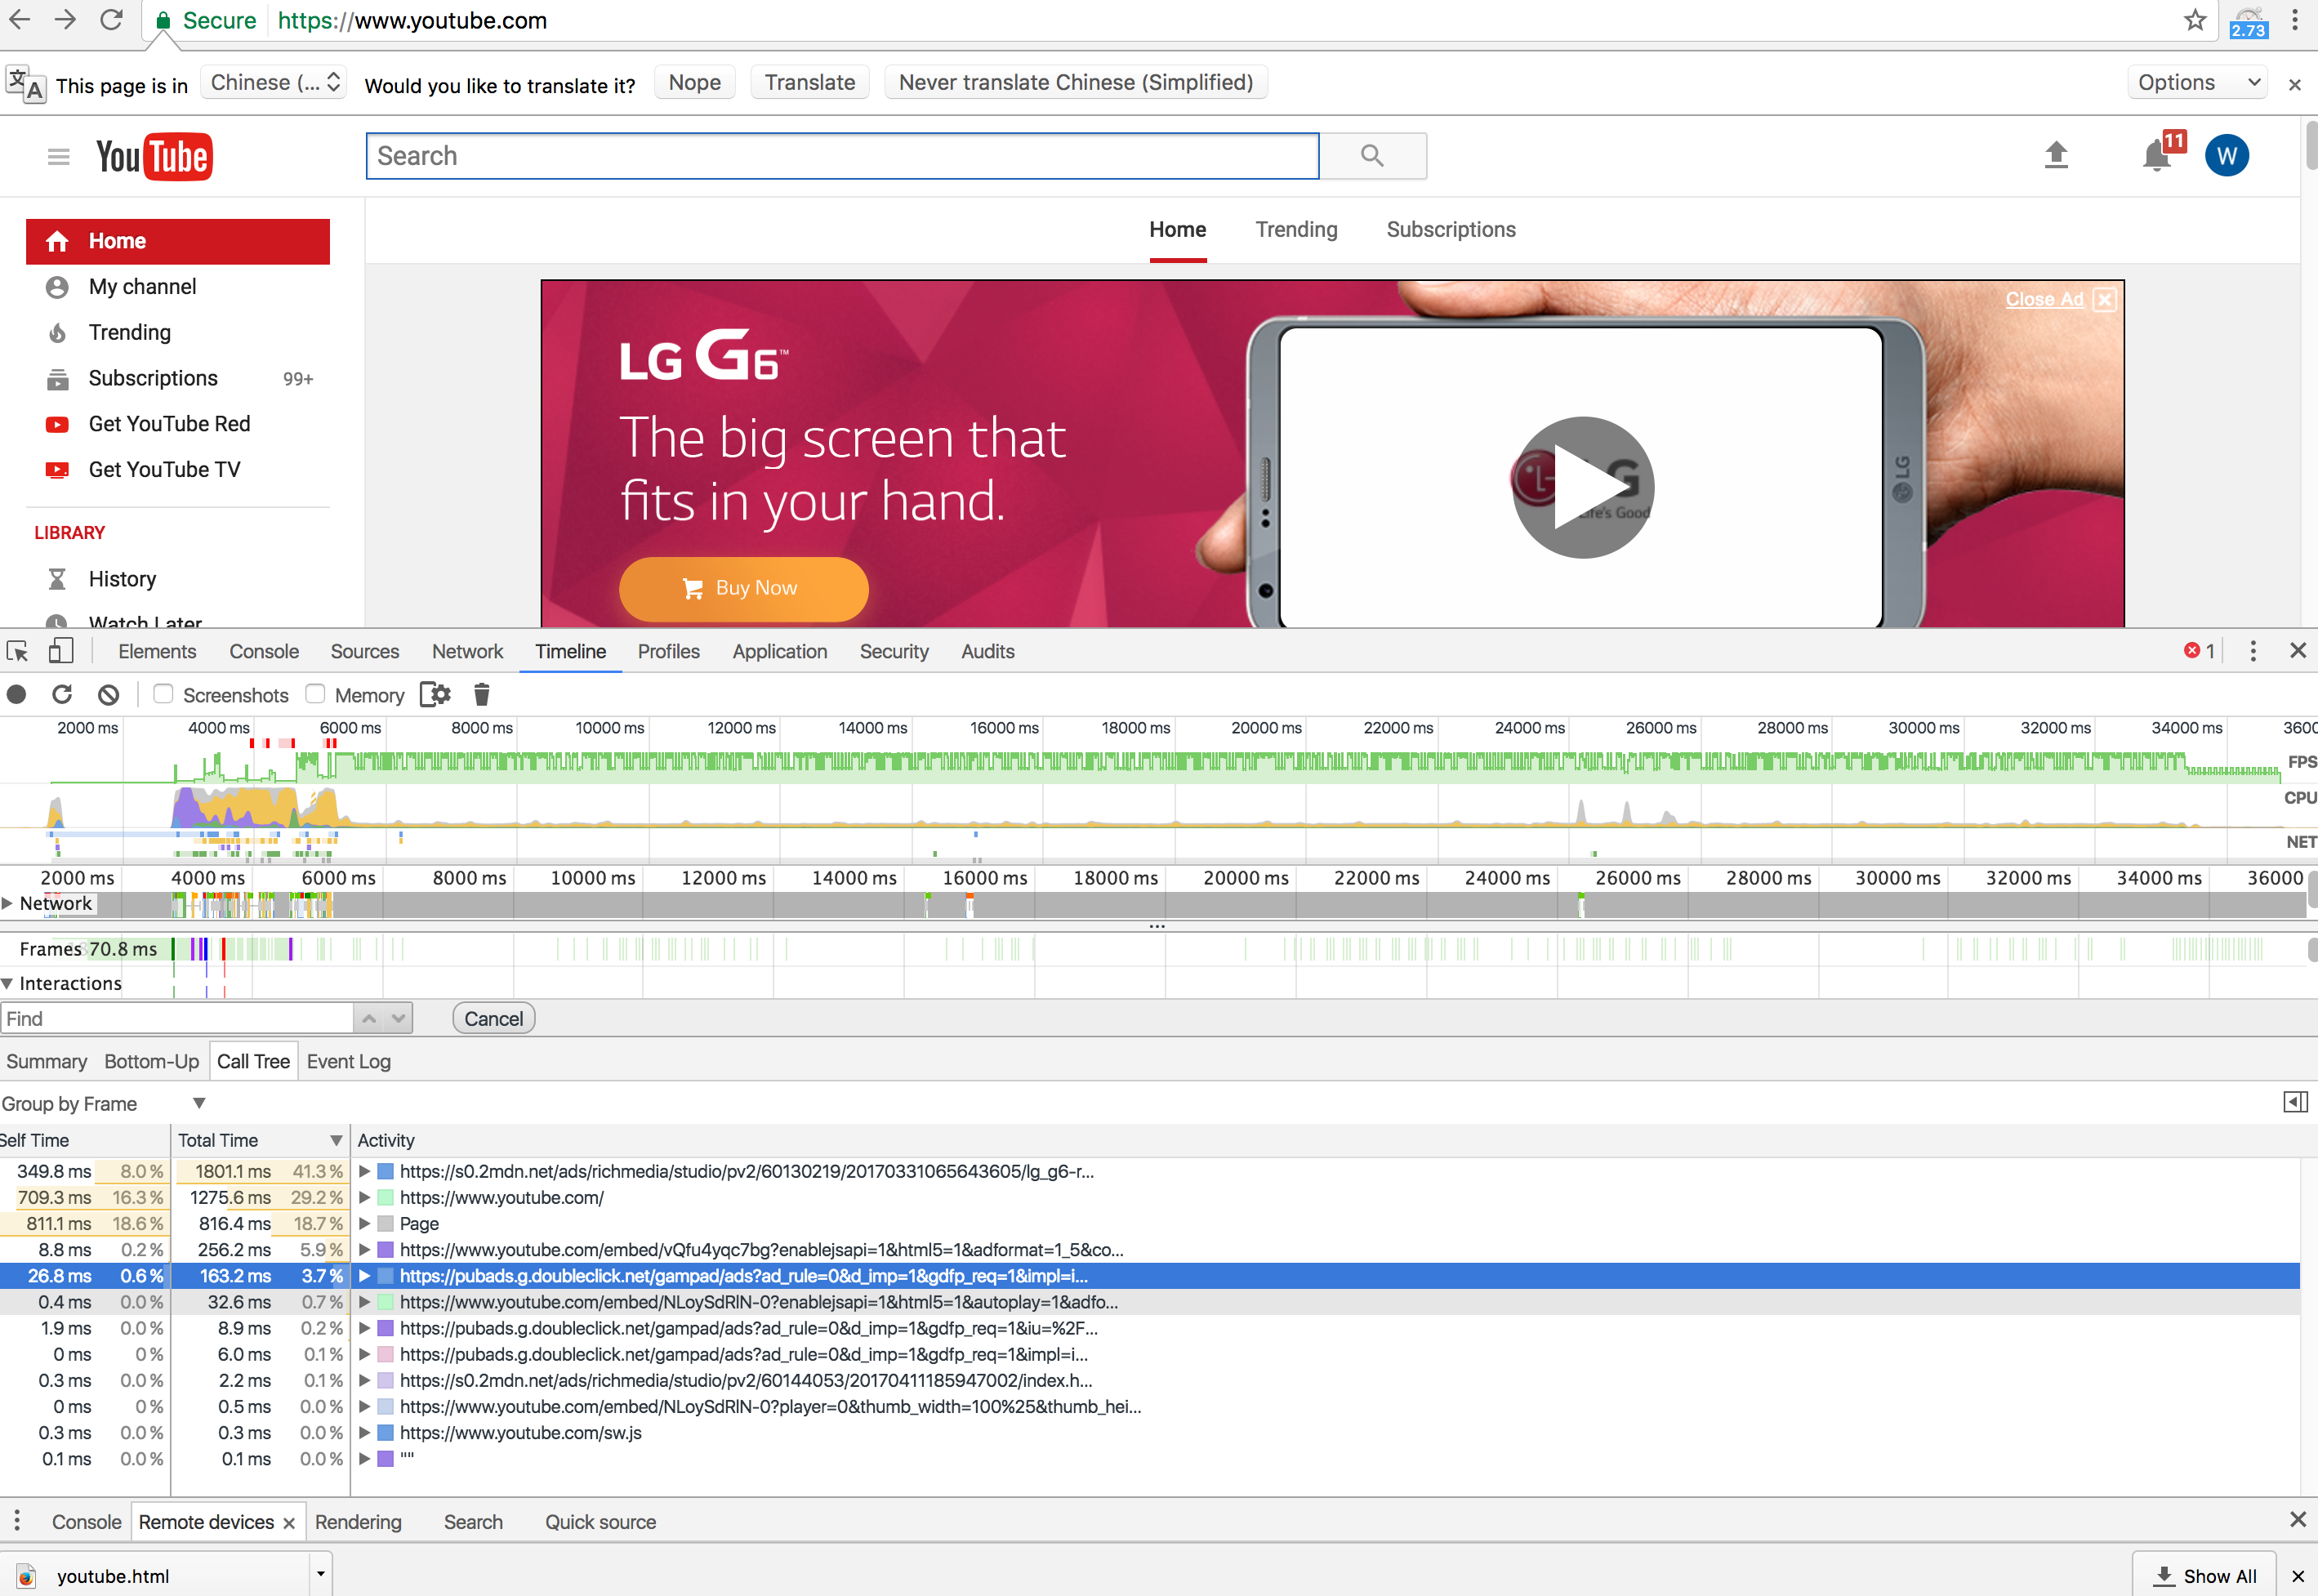
In "Call Tree" tab, the same frame takes:
Self Time: 26.8ms Total Time: 163.2ms
For the same frame, why the total time is different in two views?
I have extensively read the following doc but the documentation is not most-up-date to reflect the "group by frame" option. Moreover, besides "Self Time", "Total Time", the current version of Chrome shows "Activity" to reflect the CPU time spent not only on JS functions, but also other events such as parsing HTML, painting and rendering. However, the documentation refers to old version of Chrome which uses "Function" instead of "Activity":
In my understanding, when the third column is "Function", the total time in "Bottom-up" is the accumulated total time of that function being called during the whole recording. And the total time in "Call Tree" is the time each individual call takes. Moreover, the difference between "Self" and "Total" is that "Total" includes the time spent on callee functions. However, now when the third column changes to "Activity", plus "Group by Frame" option, the "Self Time" and "Total Time' are confusing to me.
Please advise. Thank you very much in advance!!
Regards,
Grace
Grace Wang
Apr 24, 2017, 10:42:01 PM4/24/17
to Google Chrome Developer Tools
Anyone can help on resolving the confusion?
Thanks in advance!

Alexei Filippov
Apr 25, 2017, 2:42:52 PM4/25/17
to Google Chrome Developer Tools
Hello Grace,
Consider the no-groupping case first.
The root items of the call tree are the ones that lay at the bottom of execution stack, i.e. they are the ones browser starts tasks execution with.
Examples are TimerFired event, XHR state change, etc. They in turn usually cause JS code starts execution building the call tree further.
These root items usually have longer total times, but smaller self times as they usually just pass execution to their children.
Examples are TimerFired event, XHR state change, etc. They in turn usually cause JS code starts execution building the call tree further.
These root items usually have longer total times, but smaller self times as they usually just pass execution to their children.
In contrary the root level of bottom-up tree consists of all nodes ever present in the call tree (not just root ones).
Each function has aggregated self time, e.g. the time when it was on top of the stack across all its occurances.
The aggregated total time corresponds to the time when a node was present somewhere on the stack (no necessary at the top).
Therefore the total and self times can be different for these trees as they just calculated across the different set of nodes.
When the groupping kicks in, it justs groups together root nodes that share the same property, e.g. frame or url.
Thus times can be different for groupped case, just because it is built upon the non-groupped case which already can produce different times for items.
As for Function vs. Activity it's just a pure rename, as the items in this column are not always JS functions, but can be Layouts, GCs etc.
Group by frame is indeed a new option, but in fact it is similar in behavior to the ones existed before. In just groups together root level items having identical frame property.
Cheers,
Alex
Grace Wang
Apr 25, 2017, 11:17:28 PM4/25/17
to Google Chrome Developer Tools
Hello Alex,
Thank you so much for your detailed explanation, which resolves my confusion about the difference of the (self/total) time in two views!
I am particularly interested in calculating the total CPU time spent on a specific element, e.g., a <div>, or an <iframe>. I didn't find such interface from the dev tools timeline panel. So I save a timeline profile and try to calculate the time from the log. Here is what it looks like for one activity:
{
"args": {
"beginData": {
"frame": "0x3727c8b0",
"startLine": 0,
}
},
"cat": "devtools.timeline",
"name": "ParseHTML",
"ph": "B",
"pid": 6160,
"tid": 5764,
"ts": 1108960750077,
"tts": 1209603
},
For some activities, calculations are needed in order to merge a number of activities to get the duration of a particular event, such as a function call, or parse a HTML. So to get the total time of an iframe, I can't simply add up the "dur" field of activities that with same frame id, which will miss a lot of other non-duration activities in the log.
May I know if there is specification (preferably short and quick. :) ) about the rules or the source code to calculate the total time of an iframe?
Thank you very much for your help!!
Regards,
Grace
Reply all
Reply to author
Forward
0 new messages