Timeline - Events categories
22 views
Skip to first unread message

Daniel Rosa
Jul 23, 2015, 10:28:29 AM7/23/15
to Google Chrome Developer Tools
Hi guys!
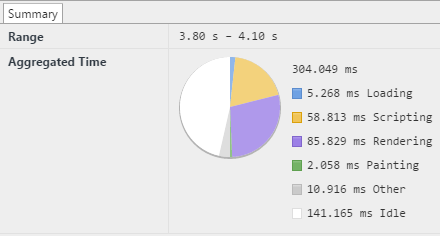
In the timeline, there are a pie chart representing the aggregated time of the recording, like the one attached.
I'm trying to understand how this characterization happens, e.g. which criteria is used to determine if certain event should be considered as Rendering.
Anyone knows the criteria for this characterization? Is it done on devtools side (frontend) or on blink side (backend)?
Cheers,
Daniel
Daniel Rosa
Jul 27, 2015, 8:47:52 AM7/27/15
to Google Chrome Developer Tools, djh...@gmail.com
Elaborating a bit more the question, and being more specific, what I aim to understand is how can I correlate the functions calls listed in chrome://tracing with the categories (Loading, Scripting, Rendering, Painting, Other) in Timeline.
E.g. In which category of timeline the call to AnimationTimeline::serviceAnimations is accounted
Cheers,
Daniel

Paul Irish
Jul 27, 2015, 4:41:36 PM7/27/15
to Google Chrome Developer Tools, djh...@gmail.com
The eventStyles object has the categorization of all RecordTypes:
Here's the mapping of RecordTypes:
It's a whitelist so not everything in tracing maps.
--
You received this message because you are subscribed to the Google Groups "Google Chrome Developer Tools" group.
To unsubscribe from this group and stop receiving emails from it, send an email to google-chrome-develo...@googlegroups.com.
To view this discussion on the web visit https://groups.google.com/d/msgid/google-chrome-developer-tools/337529f3-6f81-434c-994f-889255a7a8b0%40googlegroups.com.
Reply all
Reply to author
Forward
0 new messages