My daily quotas' gone weird all of a sudden. How do I interpret this?
50 views
Skip to first unread message

Jin Choi
Aug 24, 2016, 9:32:58 AM8/24/16
to Google App Engine
I am trying to reason with figures and percentage in my daily quotas. Not much of progress.
I'm using GAE only for api for my android app, for saving user's items count, hence no static files or so.
Just small packets coming back and forth between them.
No crons, taskqueue, or any fancy functions at all is used. Just endpoints apis and datastore are.
So far, up until yesterday, the whole requests were about 500, more or less, 18 instance hours, one-digit percentage on read/write operations.
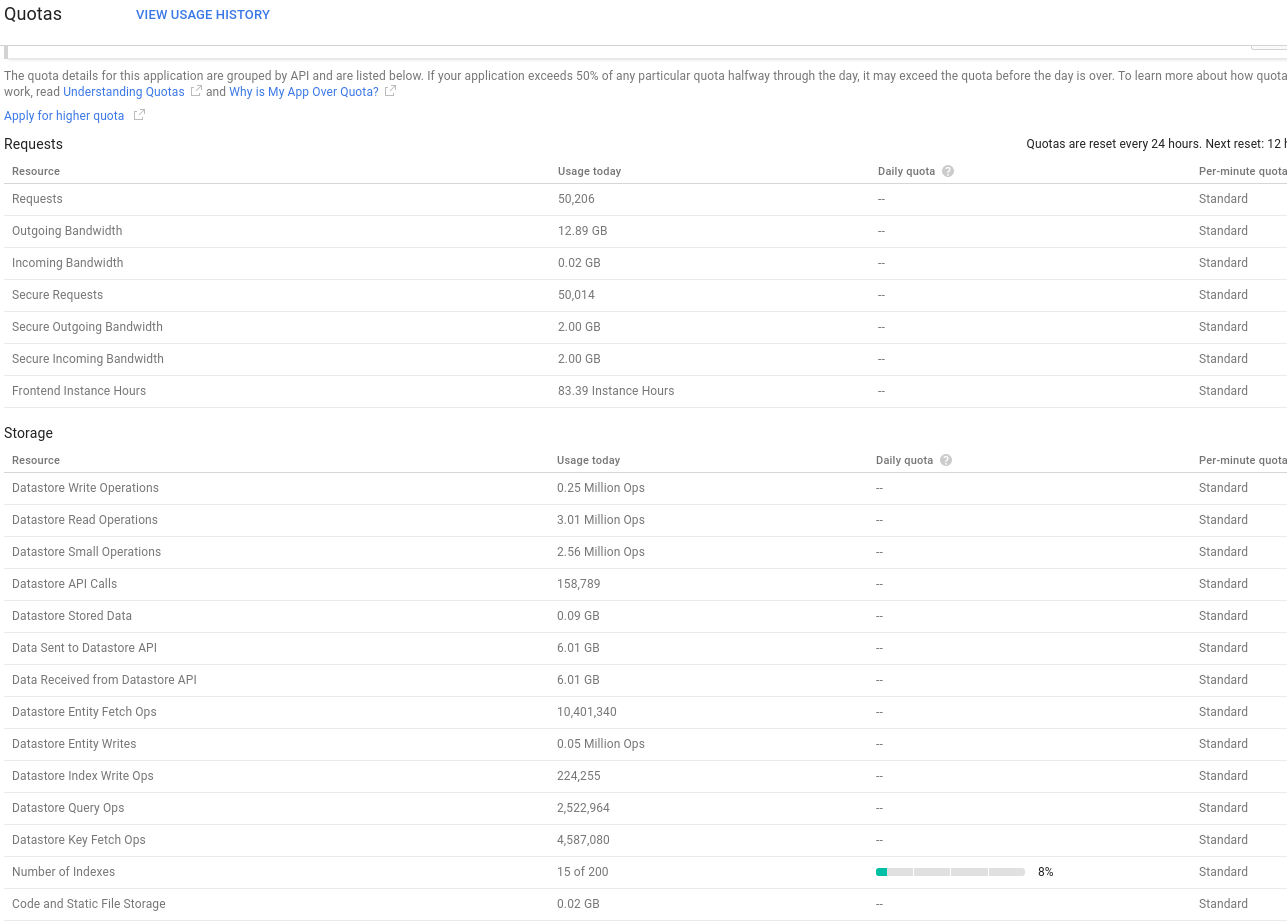
All of a sudden, today in the morning (fyi, from east Asia), requests soured up by 50,000, instance hours of 83, and check attached pic for the rest of them..
For instance hours, I guess it is possible, since I am using autoscaled option for them. Maybe GAE brought up a higher class of instance for better throughput. Just guessing.
But, I cannot even imagine how on earth requests because 50,000 over a night. I, manually, counted how many logs for requests were handled in Logs tab over the last 24 hours. The count of requests were merely over 1000. (it's about twice as much more compared to yesterday's)
Also, 3 miilion ops of Datastore Read Operations for today makes no sense at all to me. It's 300% of free quotas for read operations. It always has been about one-digit percent, at least until yesterday.
So, I'd be very thankful if you can share your insight over this ... disaster. I thought I hit the jackpot when I first saw my daily quotas status today, but it seems something else just drained my quotas, for nothing...
Thank you.

Anssi Hannula
Aug 24, 2016, 1:38:10 PM8/24/16
to Google App Engine
I also saw extremely high reported quota use on the dashboard and quotas pages yesterday, and the individual quota usage values jumped up and down over the day.
The app continued to serve, though, despite the reported resource usages significantly exceeding the daily budget.
I saw an instance hour count of 83.39 (while normal is below 20), which is very similar to what you saw.
A couple of unusual changes I saw by refreshing the quotas page and comparing the values between refreshes (at approx. 19:20 UTC on Aug 23th), was outgoing bandwidth went from 14.89 GB to 12.89 GB (actual usage was well below 1 GB), and datastore key fetch ops went from 7080 to 4587080 - note also how in both of these cases the least significant digits stayed the same.
At least the dashboard "instance count" graph was seemingly not affected, as it showed 0-1 instances over the previous 24 hours (where supposedly 83 instance hours had been used).
Attached is a screenshot of the quotas page I took when it showed weird values. Only "Incoming Bandwidth", "Datastore Stored Data", "Datastore Entity Writes", "Number of Indexes", and "Code and Static File Storage", of the quotas shown in the screenshot, are correct (or close to correct) - others are extremely inflated.
By morning of Aug 24th UTC (*before* the daily quota reset) most of the values had reverted to normal, and everything looks normal now as well.
Message has been deleted

OferR
Aug 27, 2016, 9:37:42 AM8/27/16
to Google App Engine
I'm seeing the same issue with similar numbers.
I guess it is a Google issue.
Google???
Anssi Hannula
Aug 27, 2016, 11:27:49 AM8/27/16
to Google App Engine
I'm also seeing it again right now, with instance hours again being shown as ~83.4 h (along with other inflated stats). "Estimated cost for the last 6 hours" shows $0.00 as expected though. (App ID is "intoa-design")
Reply all
Reply to author
Forward
0 new messages