Bug in Cloud Console
88 views
Skip to first unread message

Joshua Fox
Mar 21, 2018, 11:06:14 AM3/21/18
to google-a...@googlegroups.com
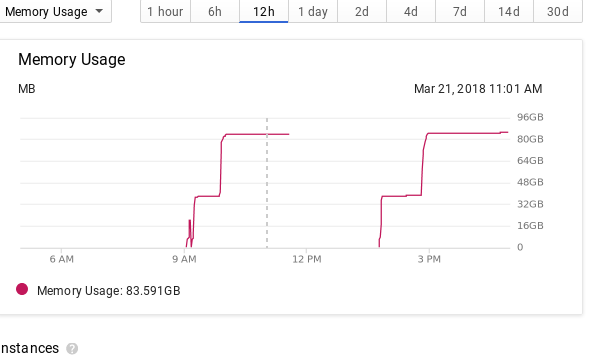
The Cloud Console Instances View https://console.cloud.google.com/appengine/instances?project=<MYPROJECT> always shows my Flexible Environment instances creeping up to the max available memory and staying there until we restart it, as if there is no Garbage Collection.
Yet by logging Runtime.getRuntime().freeMemory() and totalMemory(), we see that memory usage hovers around half the total available RAM, as expected.
What is happening? Could there be a bug in this Cloud Console view ?

Jordan (Cloud Platform Support)
Mar 21, 2018, 6:40:53 PM3/21/18
to google-a...@googlegroups.com
Instead of checking the memory usage of your application's runtime (aka the Docker container that is running your application) you should log into your GAE instance (via ssh) and check the memory usage of the actual running processes.
You may be running an older Docker image that was affected by a Fluentd Stackdriver logging memory leak which was fixed by the stackdriver team and updated in the latest GAE flex images. If you find that it is the stackdriver fluentd process that is consuming the memory, and redeploying does not resolve the issue, it is recommended to report your findings on the open Public Issue Tracker report (or open a new report if it is a different process as this may be a different memory leak).

Attila-Mihaly Balazs
Mar 22, 2018, 1:49:35 AM3/22/18
to Google App Engine
If I had to take a guess, I would say that this is because the JVM doesn't really give back "free" ram to the OS (but it's still available for reuse from within the JVM). So the console is showing the "OS" level metric while querying it directly shows the view from "inside" the JVM.
Attila
Attila
Joshua Fox
Mar 22, 2018, 4:52:26 AM3/22/18
to google-a...@googlegroups.com
On Thu, Mar 22, 2018 at 7:49 AM, Attila-Mihaly Balazs <dify...@gmail.com> wrote:
If I had to take a guess, I would say that this is because the JVM doesn't really give back "free" ram to the OS (but it's still available for reuse from within the JVM). So the console is showing the "OS" level metric while querying it directly shows the view from "inside" the JVM.
Attila
['Jordan (Cloud Platform Support)' via Google App Engine 12:40 AM] |
|
So, that metric on the Console is really about RAM taken from the OS by the JVM.
But since a Flex Env image uses the entire GCE instance, it seems that that is not the metric of interest. In other words, if we pay for 100GB Flex Env, then that is a constant from our perspective.
What we are interested in is how well our Java application is avoiding leaks in our code and dealing with GC. How would you recommend we track that?
--
You received this message because you are subscribed to the Google Groups "Google App Engine" group.
To unsubscribe from this group and stop receiving emails from it, send an email to google-appengine+unsubscribe@googlegroups.com.
To post to this group, send email to google-appengine@googlegroups.com.
Visit this group at https://groups.google.com/group/google-appengine.
To view this discussion on the web visit https://groups.google.com/d/msgid/google-appengine/32a632ab-acaa-4c76-9c4d-88d5770d37e1%40googlegroups.com.
JOSHUA FOX
Director, Software Architecture | Freightos
Smooth shipping.
Jordan (Cloud Platform Support)
Mar 24, 2018, 5:24:43 PM3/24/18
to Google App Engine
You are correct, that is indeed the memory usage of the entire instance. As previously mentioned, the best way to confirm what exactly is using all of that memory is to SSH into the instance and list the stats of each process. If it is Docker that is consuming the memory (which it most likely is) you can then use docker stats to list the exact resource usage of each Docker container.
For an example of how to analyze the JVM heap usage you can review this third-party code snippet. You can then log this with Stackdriver to keep track of your actual application memory usage. As per the Java Flex Docker image, the heap size it allocated to 80% of your instance memory size. For any issues with the JVM it is recommended to report them directly in the GitHub Issue tracker for the Docker image you are using.
Joshua Fox
Mar 25, 2018, 2:33:17 AM3/25/18
to google-a...@googlegroups.com
On Sun, Mar 25, 2018 at 12:24 AM, 'Jordan (Cloud Platform Support)' via Google App Engine <google-a...@googlegroups.com> wrote:
For an example of how to analyze the JVM heap usage you can review this third-party code snippet. You can then log this with Stackdriver to keep track of your actual application memory usage.
Yes, we use that.
You are correct, that is indeed the memory usage of the entire instance.
OK, I understand the situation now, but just out of curiosity-- what is the use case in which understanding the memory consumption of Docker is useful? After all, there is nothing contending for those resources from our perspective. When we pay for all that memory, whether we are using all of that or temporarily using less doesn't seem to matter.
Jordan (Cloud Platform Support)
Mar 25, 2018, 3:30:22 PM3/25/18
to Google App Engine
I completely agree and the engineering team is working hard on providing better Stackdriver metrics to report container level resource usage (currently no ETA for the release). For clarity, currently it is the 'bytes_used' metric that is being recorded.
As for the pricing, depending on the resource settings you specify in your app.yaml configuration file, App Engine will pick a Compute Engine machine type that most closely matches your settings. You are then charged per hour for those resources (even if you are not using them and they are idle, for example like a car rental), just like the Standard Environment and normal Compute Engine pricing.
- Therefore it is recommended to keep your instance count to a minimal to save costs by stopping previous versions, limiting max instances in your scaling settings, using minimal resource settings, and optimizing your code to respond quickly to concurrent requests as to fit as much traffic as possible onto a single instance.
- Note that Google Groups is for generic product discussions and not for reporting Google-end issues and feature requests. To receive updates on the work being done for container level resource monitoring it is recommended to open a feature request in the Public Issue Tracker.
Reply all
Reply to author
Forward
0 new messages