Gear inches / which gear?
511 views
Skip to first unread message

Steve Mansfield
Mar 8, 2014, 5:08:25 AM3/8/14
to golden-che...@googlegroups.com
G'day
GC looks interesting; one feature that would be enlightening is to calculate gear inches. If we make some assumptions, can probably estimate which gears we mostly use. Here's a blog post I wrote where I did this: http://www.hutsby.net/2013/12/what-gears-do-i-mostly-use-on-my-bike.html
Is it easily do-able?
Steve

Mark Liversedge
Mar 8, 2014, 2:33:43 PM3/8/14
to golden-che...@googlegroups.com
Would it be possible to estimate the gearing from the speed cadence chart --
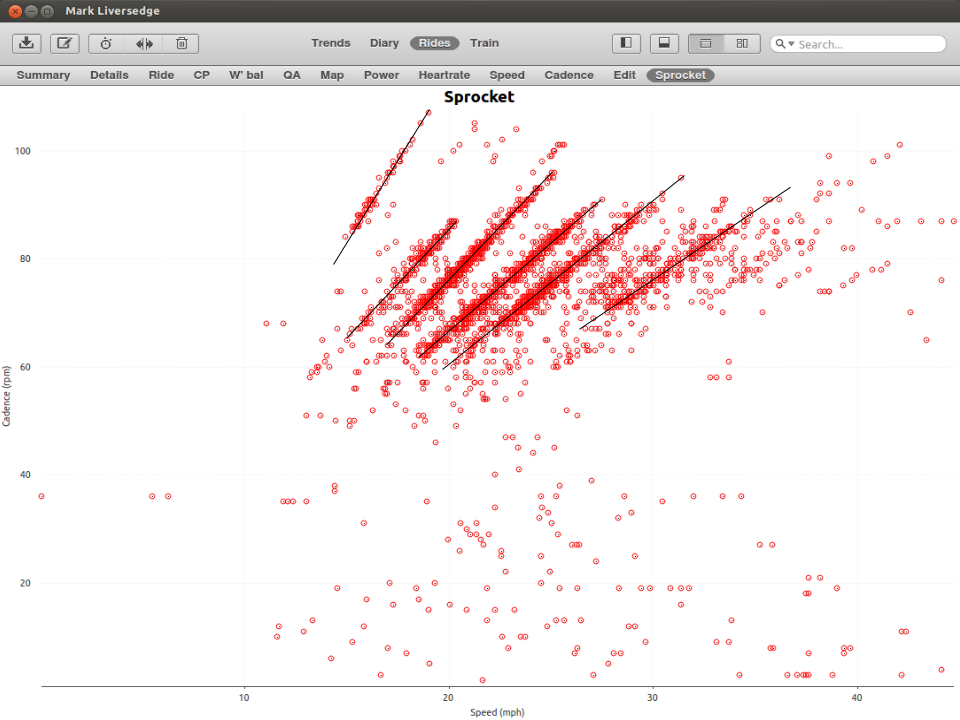
If we can identify the clusters and get the slope of the popular gearing in a ride ?
Mark

Robert Chung
Mar 8, 2014, 10:00:55 PM3/8/14
to golden-che...@googlegroups.com
On Saturday, March 8, 2014 2:08:25 AM UTC-8, Steve Mansfield wrote:
G'dayGC looks interesting; one feature that would be enlightening is to calculate gear inches. If we make some assumptions, can probably estimate which gears we mostly use.
Yes, under some circumstances it's possible to estimate the actual chain rings and cogs used even if you don't know them (though, of course, for your own bike you generally will). You do need to have good measurements of speed and cadence -- for example, the estimates are relatively noisy if you use the "virtual" cadence from a Power Tap hub. Even so, one can usually clean up the calculated gear ratios by running an odd-span running median smoother (like a "53R" smoother, i.e., repeats of 5-span followed by 3-span until convergence), with trimming at, say, gear ratios of 5.5 and 1.
You'll want the circumference of the tire.
Speed (in km/h) = cadence (in rpm) * 60 * gear ratio * tire circumference (in meters) / 1000
Thus, gear ratio = 1000 * km/h / (rpm * 60 * circumference)
Then you trim the calculated gear ratios to the range of your actual gear ratios (like a maximum of 53/11 = around 5 on the top end and 39/25 = around 1.5 on the bottom end).
Then, if you know your actual rings and cogs (which you usually will) you can assign the calculated gear ratio to the nearest actual gear ratio. Typically this will still be slightly noisy so you'll want to do the running median odd-span smooth.
You can combine this with pedal force/pedal speed and virtual slope estimates to see how you use your gears and when you shift.
Robert Chung
Mar 8, 2014, 10:09:06 PM3/8/14
to golden-che...@googlegroups.com
On Saturday, March 8, 2014 7:00:55 PM UTC-8, Robert Chung wrote:
You can combine this with pedal force/pedal speed and virtual slope estimates to see how you use your gears and when you shift.
You can see an example of this from the original "Rosetta Stone" analysis. In this graph, you can spot the difference between a 38x15 (gear ratio = 2.533) and a 52x21 (gear ratio = 2.476).

Steve Mansfield
Mar 8, 2014, 10:17:22 PM3/8/14
to golden-che...@googlegroups.com
Good that the source data allows you to go that far. A quick caluclation suggests that with a 53/39 combo some of the ratios are very close, with a 11-23 Shimano cassette:
| Gear | Ratio | Gear Selection |
| 11 | 4.818181818 | 53/11 |
| 12 | 4.416666667 | 53/12 |
| 13 | 4.076923077 | 53/13 |
| 14 | 3.785714286 | 53/14 |
| 11 | 3.545454545 | 39/11 |
| 15 | 3.533333333 | 53/15 |
| 16 | 3.3125 | 53/16 |
| 12 | 3.25 | 39/12 |
| 17 | 3.117647059 | 53/17 |
| 13 | 3 | 39/13 |
| 19 | 2.789473684 | 53/19 |
| 14 | 2.785714286 | 39/14 |
| 15 | 2.6 | 39/15 |
| 21 | 2.523809524 | 53/21 |
| 16 | 2.4375 | 39/16 |
| 23 | 2.304347826 | 53/23 |
| 17 | 2.294117647 | 39/17 |
| 19 | 2.052631579 | 39/19 |
| 21 | 1.857142857 | 39/21 |
| 23 | 1.695652174 | 39/23 |
For me, I almost* never come off the big ring, so overlapping ratios would not be a problem.
*5 occasions in 7 months.
Robert Chung
Mar 9, 2014, 12:03:15 AM3/9/14
to golden-che...@googlegroups.com
On Saturday, March 8, 2014 7:17:22 PM UTC-8, Steve Mansfield wrote:
19 2.789473684 53/19 14 2.785714286 39/14
Yeah, you might have difficulty differentiating these two in numeric terms but often you can figure it out from behavioral clues. If you examine the gear ratios used before and after you can generally recognize which pattern is consistent with a cog change on the same chain ring since we usually don't do both a change in chain ring and then across two or more cogs and back. So, if you see something like this it's still often possible to identify the exact ring and cog. Anyway, that's just an aside -- in general, what we're mostly interested in is the gear ratio, not the exact ring and cog (there are a couple of situations where you could be interested in the exact ring and cog (like if you're doing drive train loss measurements) but they're uncommon).

Pete from AUS
Apr 2, 2014, 6:39:16 AM4/2/14
to golden-che...@googlegroups.com
iBike units give gear ratio in the ride data and it is handy to back-check that your wheel circumference is correct - ie if you ride in say 39x13 you should see a gear ratio of 3.00
This of course relates to setups measuring speed with magnet & sensor.
This of course relates to setups measuring speed with magnet & sensor.
Pete from AUS
Oct 15, 2014, 9:40:47 PM10/15/14
to golden-che...@googlegroups.com
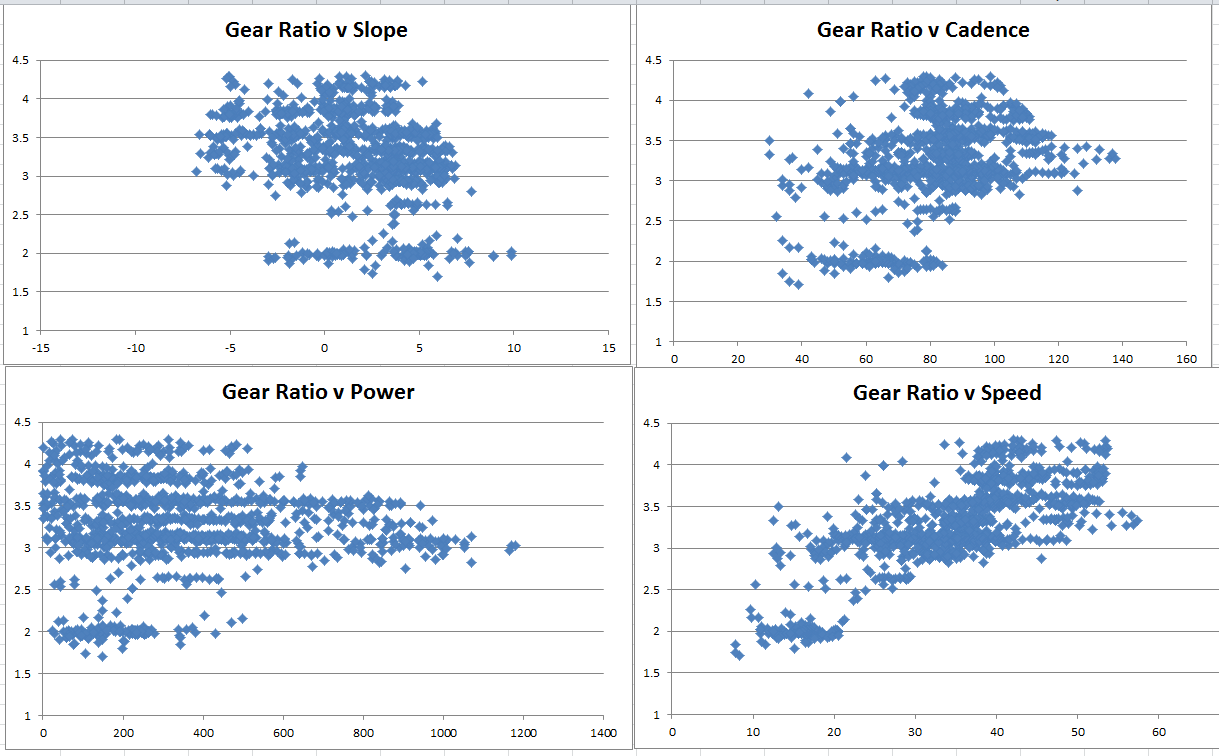
Did some 2d plots in Excel from random ride CSV data
Only calculated where I had power & cadence.
Only plotted where ratio was between 1 & 4.3 (34/25 & 50/12 with some slack)
In GC could also be a ride plot metric or a 3d plot
Pete from AUS
Oct 15, 2014, 10:06:11 PM10/15/14
to golden-che...@googlegroups.com
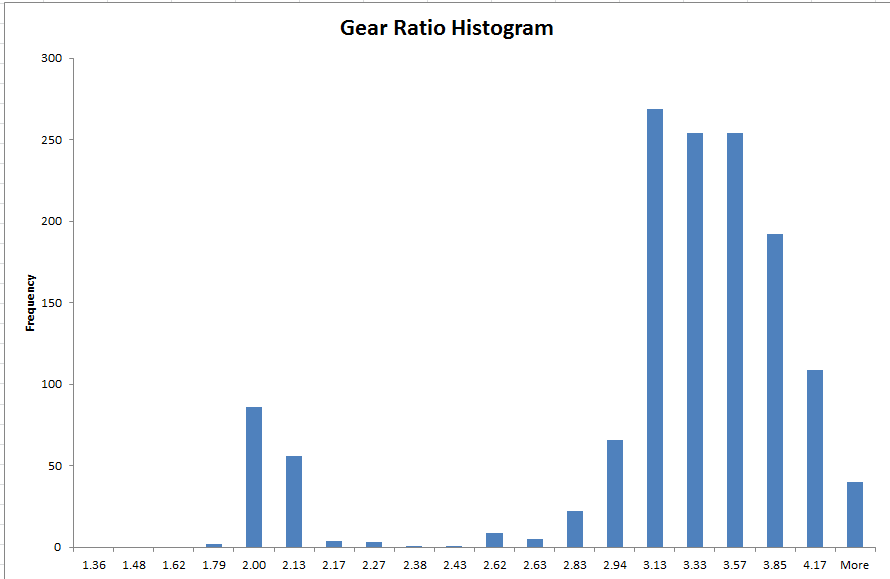
And in Histogram format with the bins approximating the cassette increments
The 2d scatter plots would probably be most useful in 'compare' mode.
I don't think compare pane is available for general 2d plots yet?
Mark Liversedge
Oct 16, 2014, 4:48:24 PM10/16/14
to golden-che...@googlegroups.com
I've added gear ratio as a data series to plot on the ride plot, 2d, 3d.
It is derived from speed/cadence.
Dr Chung came up with a good idea to color code points on the PfPv (QA) plot by gear ratio and/or slope too, which could be interesting. Joern is looking at how we can do that too :)
Mark
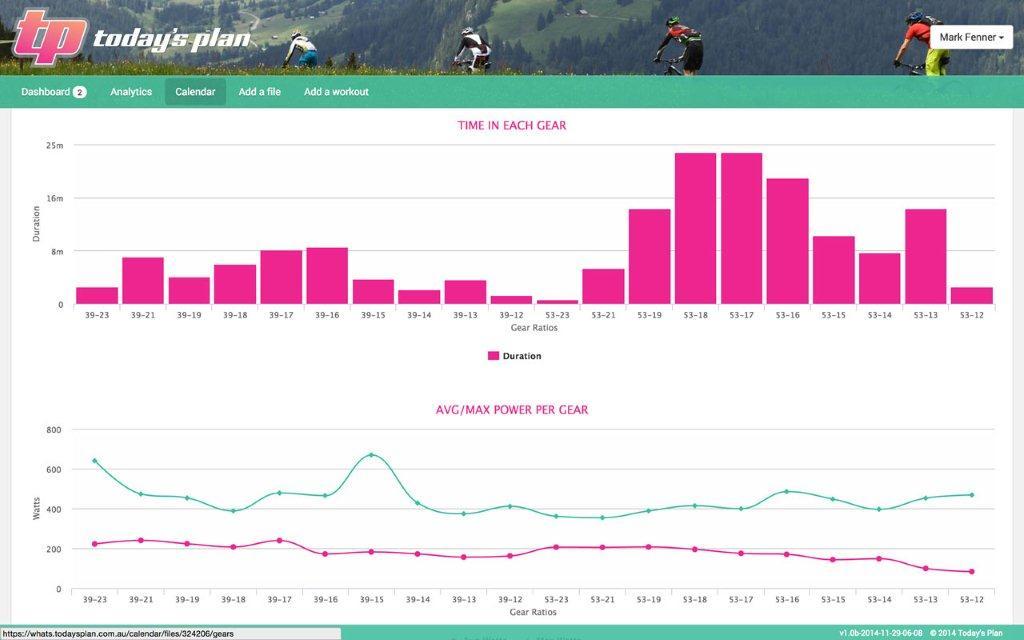
Mark Liversedge
Oct 16, 2014, 4:48:57 PM10/16/14
to golden-che...@googlegroups.com
Pic to go with that:


Jörn R.
Feb 5, 2015, 8:17:35 AM2/5/15
to golden-che...@googlegroups.com
Looks nice - in order to get that we need to add the DI2 gear data.
Then having such an analysis should not be to difficult to build.
The DI2 stuff is "private ANT" - so nothing published - which would
require reverse engineering of the .FIT files created.
The gear/ratio we have added is based on speed/cadence -
whilst trying to force the values into discrete sections. Not accurate
though, but an indication.
Joern
Mark Liversedge
Feb 5, 2015, 8:40:39 AM2/5/15
to golden-che...@googlegroups.com
On Thursday, 16 October 2014 03:06:11 UTC+1, Pete from AUS wrote:
And in Histogram format with the bins approximating the cassette incrementsThe 2d scatter plots would probably be most useful in 'compare' mode.I don't think compare pane is available for general 2d plots yet?
Damien added this in v3.2
I think we need a way of recording equipment / crank/cassette info to 'bin' the data right.
Mark

Tom Bammann
Feb 9, 2016, 6:12:29 PM2/9/16
to golden-cheetah-users
Hi all,
I'm a new user to GC, an amateur cyclist that's getting back into it and enjoying exploring all the features of GC. I've come from using trainingpeaks and find it fascinating that you've achieved such powerful software that's free for us to use. Much appreciative of the authors and contributors!
There's another thread about D-Fly data that I recently posted in, but I'm interested to see Joern's comment about D-Fly data being 'private ant', and that it would have to be reverse engineered. Noting that http://di2stats.com/ is available for uploading .FIT files to, which then interprets, and displays all gear change data, presumably the reverse engineering has already been done by Briane Toone who is collecting data to publish a journal article on shifting statistics.
I feel it would be out of place for me to enquire about collaborating with the GC development team, but I see it as a great opportunity :) Especially if there is some integration with GC which might auto-upload people's .FIT files to his server for inclusion in his study? Could be a win-win for him to share his D-Fly code with GC team in exchange for more data for his study?
Just a thought :)
Cheers
Reply all
Reply to author
Forward
0 new messages