ggpdotplot
21 views
Skip to first unread message


Brian
Aug 20, 2015, 2:03:57 AM8/20/15
to sam4hi, ggplot2
-----BEGIN PGP SIGNED MESSAGE-----
Hash: SHA256
you have pot: you're fine!
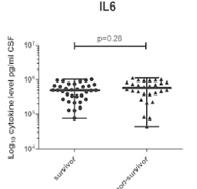
it appears you want a boxpot, mapped according to survival status.
Something like this should work!
library(ggplot2); ggpot = ggplot
data = data.frame(survival=sample(c("munchies found", "munchies NOT
found"),
100, T),
## On a scale of...
paranoia=sample(1:10, 100, T)
)
ggpot(data, aes(survival, paranoia)) + geom_boxplot()
Cheers!
-----BEGIN PGP SIGNATURE-----
Version: GnuPG v2
iQIcBAEBCAAGBQJV1W2dAAoJEB+kbV9VX51IvVgQAK7RXbRIGZeiS7Wq7pee7rp3
vqtT1eie+COvKtXrmLVTe+60MWlRdY8oukL3Qy4SqRjfl6UwrIBjacQNMaxqSX99
YfAbTWyvG4FDXUnNEQkoYaGJTZg0KI457RoZDosiOmgYjRnRpfK1ffuMV9kpbRyQ
cXqaDQSIq9fwJB6Aqd2NySkbFg1zY1TIfFNkiQMqiJkvM8IxV1yqdDn+OvJxwCAC
WVkjw8BqAn2q451ZOPiLr4pjSszVOPOq5CGqZF/S+i1QgjYYsO8BbliYWgOBPIMt
TWrbtChMxn6ixiBKHzseAIQcXCH0qjSTF2zmZWOov+RemE4DRiMi1cHmjITFIMJg
N0H3847WtC8kFm23bo5HRZek61le/HpSlucnd65VlDMGEWUPuJfp9Hmvf4L95mEz
smMU4dSgBN4Z1iFwmJC8yJ7hqeJUgKz7RQH629EuuEJs1PTHrwPv66eGJU2iMCIS
EDGDPrUqNnNwq3wlAwDGhpSjVNBqwnTa9iv+FulJcOB9L9lwhMeNgRPremjvFkJQ
3CCHYoQbpKBPzOPo124xBd6HvuWpjio3NaNbmHkxSQYWumVGXzy5W0z/DPX9kfuV
i/ENBdx67KyGSeFAMkAZed7+6SDionaBT9NXaNKajWhTFCSlkGBNvwiH4ihvjxMR
I/SlffYKmOw4QV3cWOgR
=xOt/
-----END PGP SIGNATURE-----
Hash: SHA256
you have pot: you're fine!
it appears you want a boxpot, mapped according to survival status.
Something like this should work!
library(ggplot2); ggpot = ggplot
data = data.frame(survival=sample(c("munchies found", "munchies NOT
found"),
100, T),
## On a scale of...
paranoia=sample(1:10, 100, T)
)
ggpot(data, aes(survival, paranoia)) + geom_boxplot()
Cheers!
Version: GnuPG v2
iQIcBAEBCAAGBQJV1W2dAAoJEB+kbV9VX51IvVgQAK7RXbRIGZeiS7Wq7pee7rp3
vqtT1eie+COvKtXrmLVTe+60MWlRdY8oukL3Qy4SqRjfl6UwrIBjacQNMaxqSX99
YfAbTWyvG4FDXUnNEQkoYaGJTZg0KI457RoZDosiOmgYjRnRpfK1ffuMV9kpbRyQ
cXqaDQSIq9fwJB6Aqd2NySkbFg1zY1TIfFNkiQMqiJkvM8IxV1yqdDn+OvJxwCAC
WVkjw8BqAn2q451ZOPiLr4pjSszVOPOq5CGqZF/S+i1QgjYYsO8BbliYWgOBPIMt
TWrbtChMxn6ixiBKHzseAIQcXCH0qjSTF2zmZWOov+RemE4DRiMi1cHmjITFIMJg
N0H3847WtC8kFm23bo5HRZek61le/HpSlucnd65VlDMGEWUPuJfp9Hmvf4L95mEz
smMU4dSgBN4Z1iFwmJC8yJ7hqeJUgKz7RQH629EuuEJs1PTHrwPv66eGJU2iMCIS
EDGDPrUqNnNwq3wlAwDGhpSjVNBqwnTa9iv+FulJcOB9L9lwhMeNgRPremjvFkJQ
3CCHYoQbpKBPzOPo124xBd6HvuWpjio3NaNbmHkxSQYWumVGXzy5W0z/DPX9kfuV
i/ENBdx67KyGSeFAMkAZed7+6SDionaBT9NXaNKajWhTFCSlkGBNvwiH4ihvjxMR
I/SlffYKmOw4QV3cWOgR
=xOt/
-----END PGP SIGNATURE-----

Roman Luštrik
Aug 20, 2015, 4:53:35 AM8/20/15
to sam4hi, ggplot2
I think your plot is a combination of dotplot and vertical and horizontal error bars. The horizontal lines appear to be some kind of mean or some other statistic, which can be achieved using geom_hline.
Cheers,
Roman
--
--
You received this message because you are subscribed to the ggplot2 mailing list.
Please provide a reproducible example: https://github.com/hadley/devtools/wiki/Reproducibility
To post: email ggp...@googlegroups.com
To unsubscribe: email ggplot2+u...@googlegroups.com
More options: http://groups.google.com/group/ggplot2
---
You received this message because you are subscribed to the Google Groups "ggplot2" group.
To unsubscribe from this group and stop receiving emails from it, send an email to ggplot2+u...@googlegroups.com.
For more options, visit https://groups.google.com/d/optout.
In God we trust, all others bring data.
Reply all
Reply to author
Forward
0 new messages