ggplot grouping by a dichotomous variable not working
238 views
Skip to first unread message

John T
Oct 1, 2015, 1:29:43 PM10/1/15
to ggplot2
I'm fairly new to ggplot2, so this is probably a simple mistake. When I do this:
F3.plot <- ggplot(F3, aes(factor(year), mean(cd), color = factor(failure))) +
geom_line() +
geom_point(size=2)
F3.plot
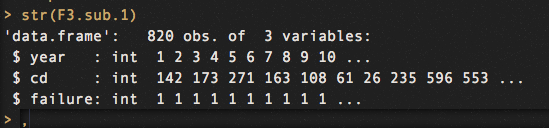
I get the attached graph. I'm trying to graph 2 variables by a third, a dichotomous 0 and 1. I suspect the problem is related to the data types, but can't seem to figure out, so in the interest of time, I'd thought I'd ask. I searched the postings and couldn't find anything. Does anyone know why the data is not separating the third variable, called "failure". I also posting the data types. I know for a fact that the 0 and 1 differ by a considerable amount, so it's not mapping the data. I'm taking the mean of the cd variable at ten time points (years). The dataset is F3. Thanks.

Brandon Hurr
Oct 1, 2015, 1:42:42 PM10/1/15
to John T, ggplot2
I postulate that it is in fact there, but they are overplotting.
I believe your problem is "mean(cd)", which is taking the mean of the entire column and using that as the y value for all points.
Could you post a full example dataset so we can check for sure?
--
--
You received this message because you are subscribed to the ggplot2 mailing list.
Please provide a reproducible example: https://github.com/hadley/devtools/wiki/Reproducibility
To post: email ggp...@googlegroups.com
To unsubscribe: email ggplot2+u...@googlegroups.com
More options: http://groups.google.com/group/ggplot2
---
You received this message because you are subscribed to the Google Groups "ggplot2" group.
To unsubscribe from this group and stop receiving emails from it, send an email to ggplot2+u...@googlegroups.com.
For more options, visit https://groups.google.com/d/optout.

Vivek Patil
Oct 1, 2015, 1:55:11 PM10/1/15
to John T, ggplot2
As of now, your mean(cd) is probably computing a single value for the variable.... I assume you want to compute means of cd across the two levels of failure. You could either compute the means outside of the ggplot environment or use stat_summary to do it within the call. See http://docs.ggplot2.org/current/stat_summary.html
For example,
year=c(1:10)
cd=rnorm(10,100,100)
failure=rep(c(0,1),5)
df=data.frame(year,cd,failure)
library(ggplot2)
library(dplyr)
df%>%group_by(year,as.factor(failure))%>%
summarize(mean=mean(cd))%>%
ggplot(aes(x=year,y=mean,color=as.factor(failure),group=as.factor(failure)))+geom_line()+geom_point(size=2)
As Brandon mentions, a reproducible dataset will come in very handy.
On Thu, Oct 1, 2015 at 9:59 AM, John T <jtca...@gmail.com> wrote:
--
Brandon Hurr
Oct 1, 2015, 2:24:10 PM10/1/15
to john, Vivek Patil, ggplot2
A small change to Vivek's code will do for what you need I think.
require(readr)
require(dplyr)
require(ggplot2)
df <- read_csv("~/Downloads/f3sub.csv")
df%>%group_by(year, failure)%>%
summarize(mean=mean(cd))%>%
ggplot(aes(x=year,y=mean,color=as.factor(failure),group=as.factor(failure)))+geom_line()+geom_point(size=2)
When grouping, you don't need to use as.factor(), in fact it seems to break it.
Error in UseMethod("depth") :
no applicable method for 'depth' applied to an object of class "NULL"
John T
Oct 1, 2015, 11:33:57 PM10/1/15
to ggplot2, jtca...@gmail.com, pat...@gmail.com
I'm getting this:
> df%>%group_by(year, failure)%>%
+ summarize(mean=mean(cd))%>%
+ ggplot(aes(x=year,y=mean,color=failure, group=failure)) +
+ geom_line() +
+ geom_point(size=2)
Error in eval(expr, envir, enclos) : object 'year' not found
Not found. Don't have time to work on this right now. I tried including factor for year and got the same error. This is after installing the packages.
John T
Oct 2, 2015, 3:13:21 AM10/2/15
to ggplot2, jtca...@gmail.com, pat...@gmail.com
Tried this:
Still got the flat line, no separation of the groups by failure.
F3 %>% group_by(year, failure) %>% summarize(mean=mean(cd))%>%
ggplot(., aes(x=year,y=mean, color=as.factor(failure), group=as.factor(failure))) +
geom_line()+
geom_point(size=2)
They are different:
> sub.df0 <- subset(sub.df$cd, failure == "0")
> mean(sub.df0)
[1] 432.86
> sub.df1 <- subset(sub.df$cd, failure == "1")
> mean(sub.df1)
[1] 466.48
>
Vivek Patil
Oct 2, 2015, 7:50:21 AM10/2/15
to John T, ggplot2
Instead of ggplot(., aes(..
Try ggplot(aes(..
Vivek Patil
Oct 2, 2015, 8:15:52 AM10/2/15
to John T, ggplot2
John, sorry, please disregard my earlier email. Your code works and so should my suggestion.
John T
Oct 2, 2015, 8:30:12 AM10/2/15
to ggplot2
It's not calculating a mean cd by year, just an overall mean, so the plot is just a horizontal line.
John T
Oct 2, 2015, 8:36:27 AM10/2/15
to ggplot2
Two groupings, first mean cd by year, then by a dichotomous variable (0, 1)
On Friday, October 2, 2015 at 12:29:43 AM UTC+7, John T wrote:
Reply all
Reply to author
Forward
0 new messages