GEOM_BAR (changing the order)
30 views
Skip to first unread message

Pradip
May 13, 2016, 7:37:24 PM5/13/16
to ggplot2
Hello,
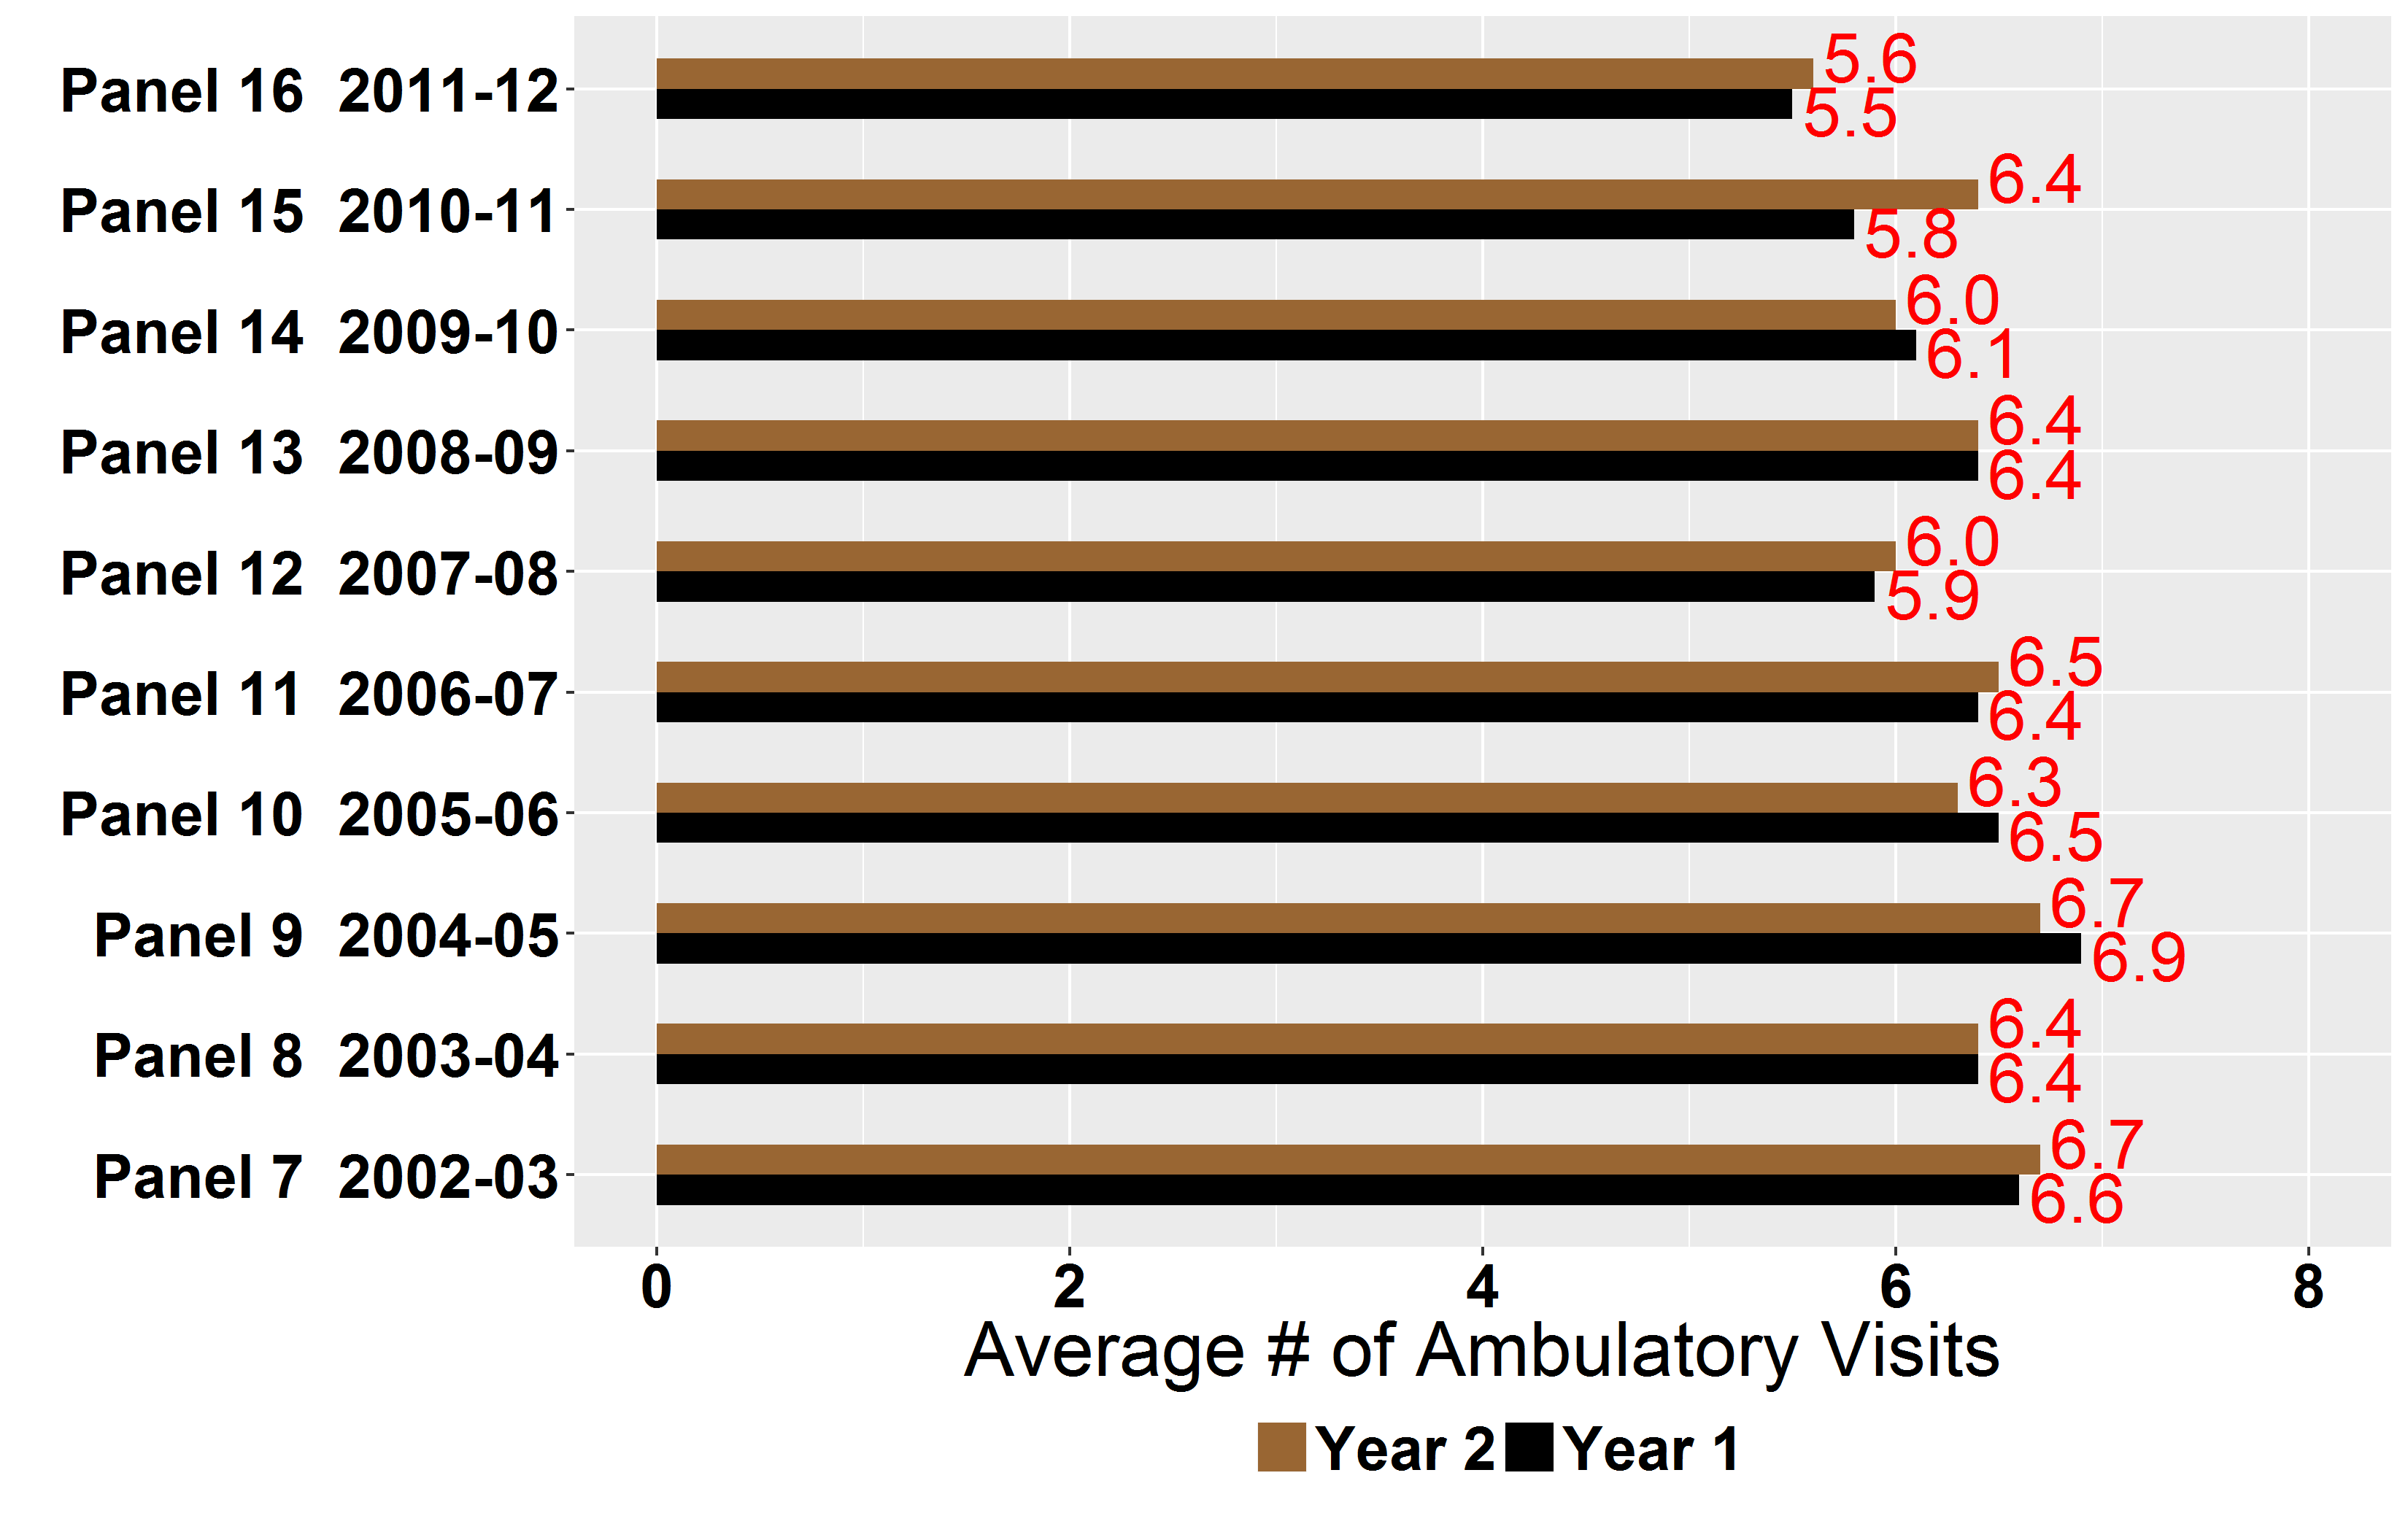
Attached are my R/ggplot2 code and the bar graph. The code has produced the desired bar graph except that
a) the x-axis values are in different order [panel 16 (topmost) and panel 7 (bottommost)]. I want panel 7 to be the topmost and panel 16 to be the bottommost.
b) the Year 2 bar is followed by Year 1 bar for each panel. I want Year 2 bar to be placed after Year 1 bar when stacked.
Any help with revisions of the code to resolve the above issues would be highly appreciated.
Thanks,
Pradip Muhuri
*********************** part of attachment 1 *****************************
p <- ggplot(data = tempdata, aes(x = add_col, y = est, ymin=0, ymax=8,
fill = spd)) +
geom_bar(position="dodge", stat="identity", width=0.50) +
geom_text (aes(label=formatC(tempdata$est, format="f", digits=1)),
position=position_dodge(width=0.9),
hjust=-.1, vjust=.4, colour="red", size=8) +
scale_fill_manual(values=c("black", "#996633"))+
labs (x = " ", y= "Average # of Ambulatory Visits", fill=" ")+
ylim (0,8)+
coord_flip()+
theme(text = element_text(size = 25, face = "bold"),
axis.text.x = element_text(vjust = 0, colour="black"),
axis.text.y = element_text(hjust = 1, colour="black"),
axis.title.y = element_text(size = rel(0.4), colour="black"),
axis.title.x = element_text( face = "plain"),
legend.text = element_text(size = rel(0.8), hjust = 0),
legend.position = "bottom")+
guides(fill = guide_legend(reverse=TRUE))
print (p)
ggsave(file='amb_visits_by_yr_in_panel.png', width=11, height=7)
ggsave(file='amb_visits_by_yr_in_panel.png', width=11, height=7)
Pradip
May 14, 2016, 9:08:00 AM5/14/16
to ggplot2
Hello,
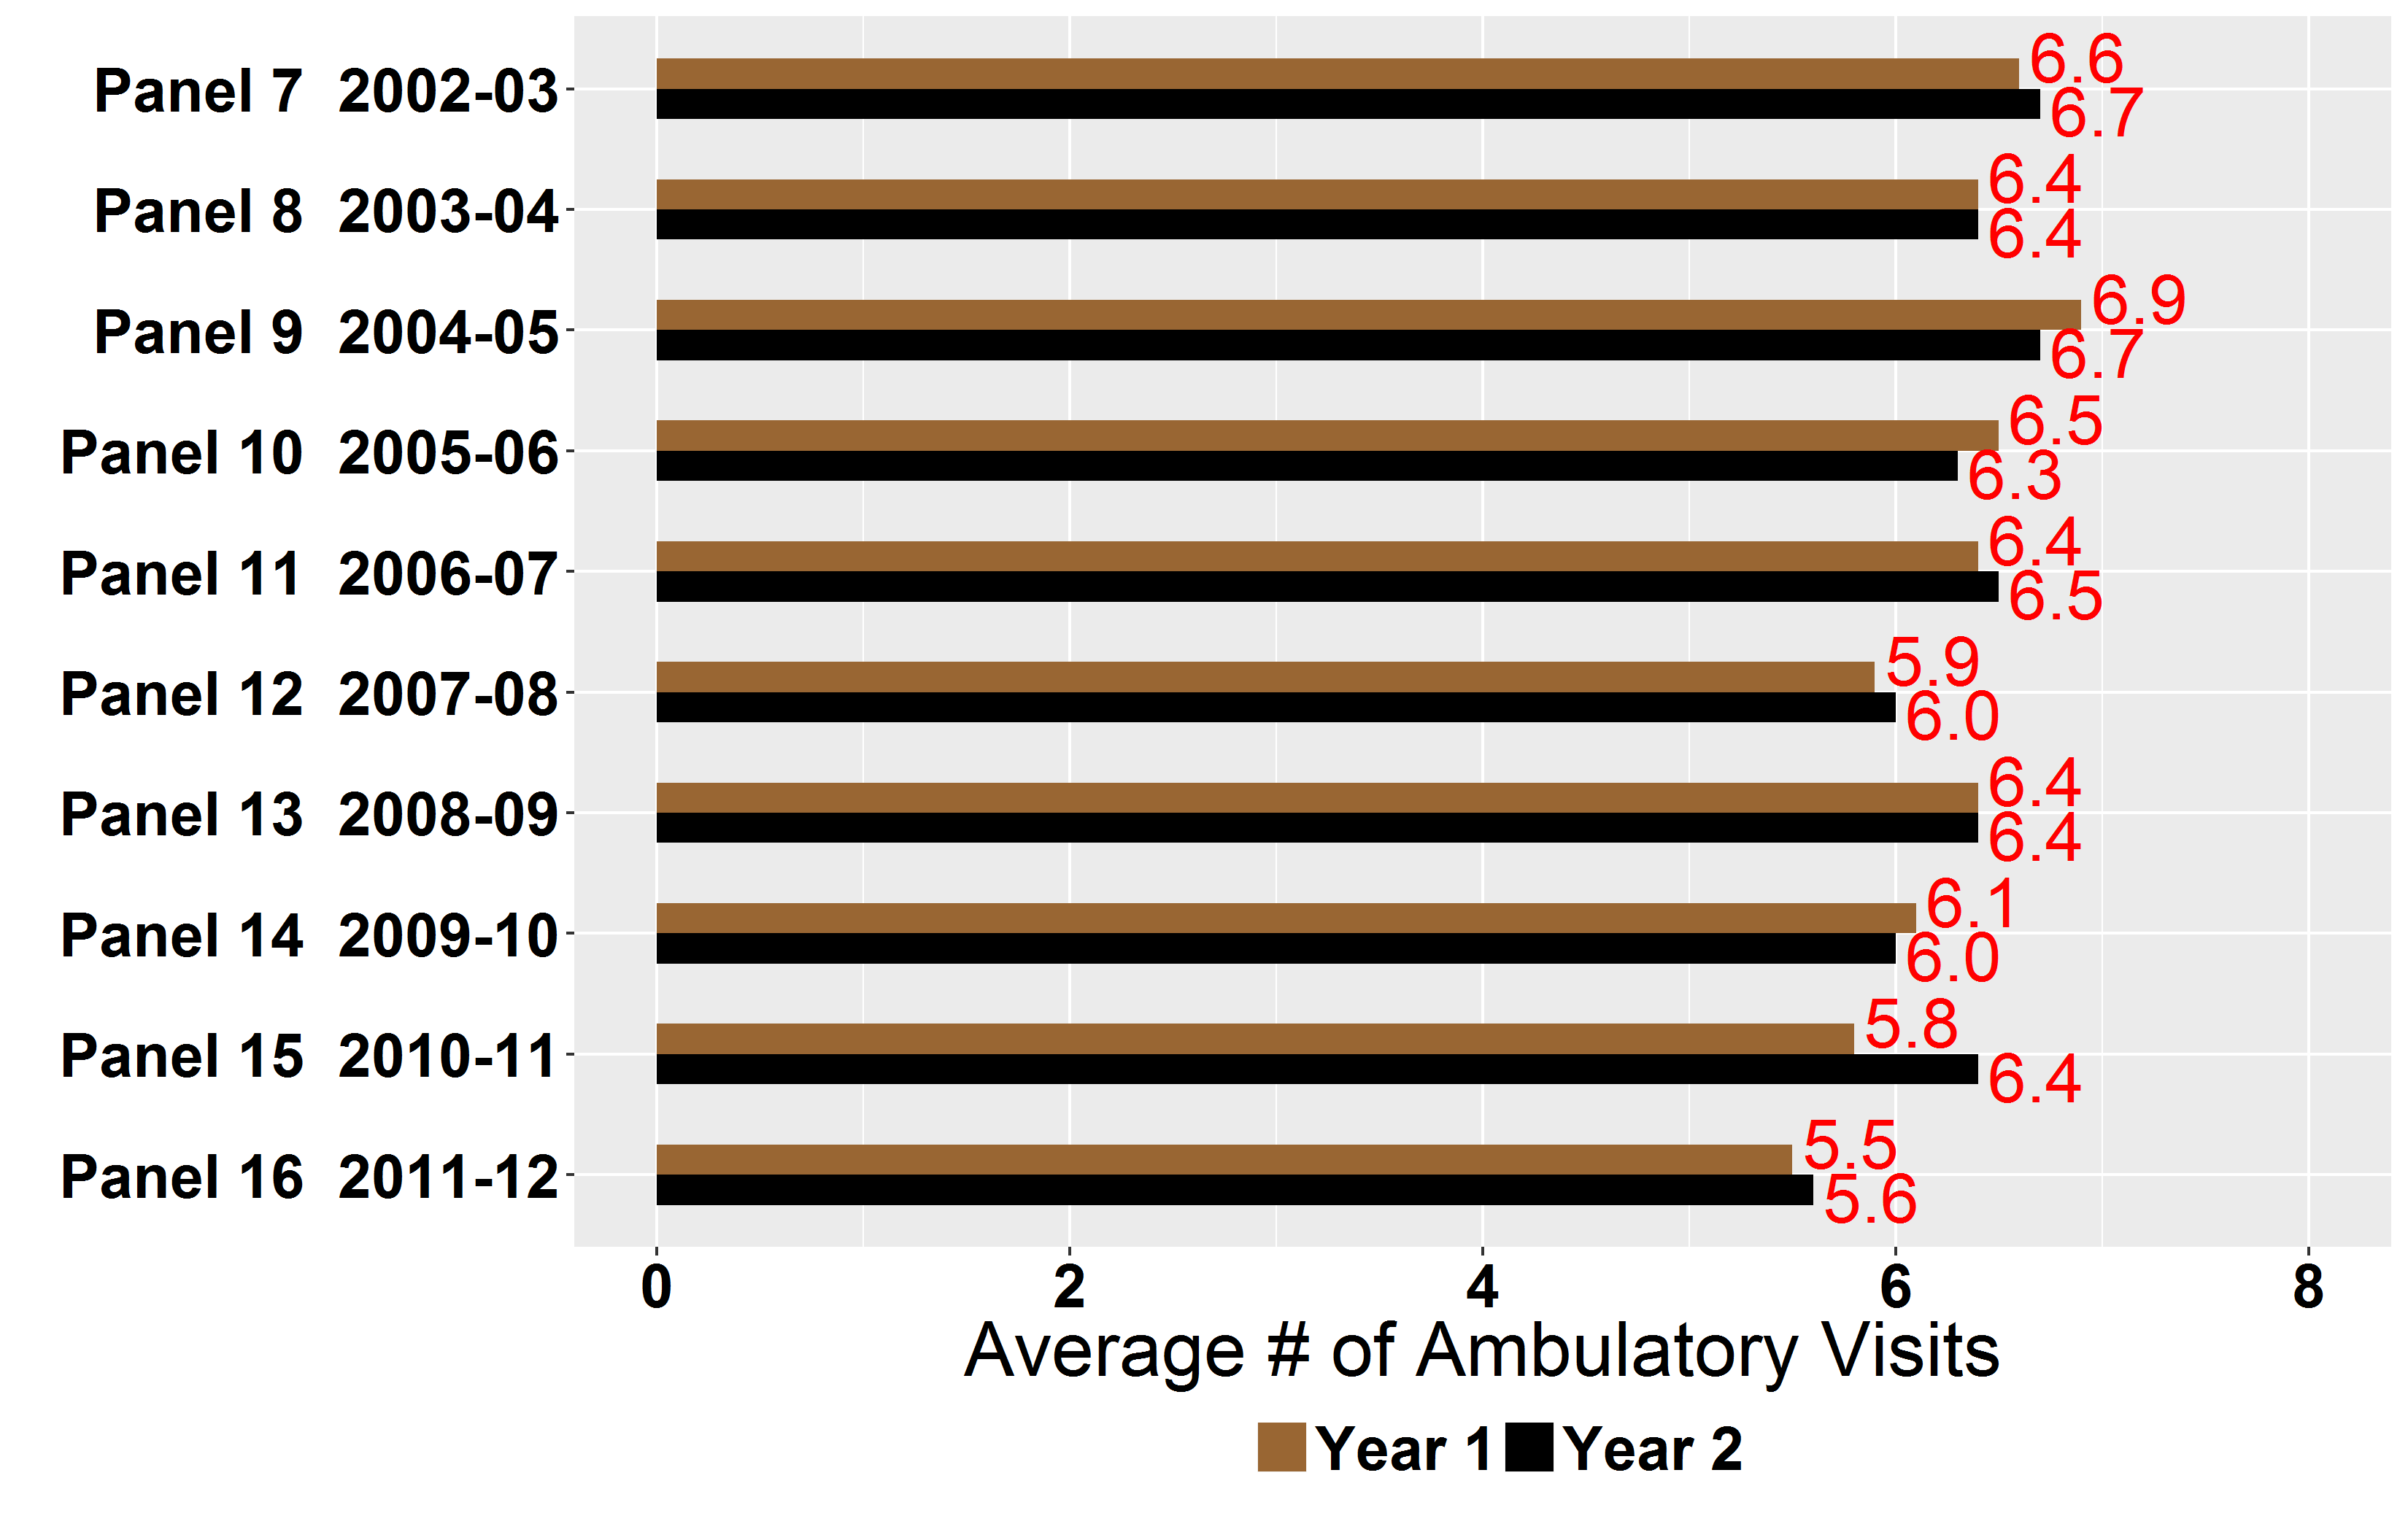
I believe I have resolved the issue by reordering the factor levels in the chart.
# The following codes are inserted ...
tempdata$spd <- factor(tempdata$spd, levels=rev(levels(tempdata$spd)))
tempdata$add_col <- factor(tempdata$add_col, levels=rev(levels(tempdata$add_col)))
The revised chart is attached.
Thanks,
Pradip
Reply all
Reply to author
Forward
0 new messages