different legends from two different data.frames
29 views
Skip to first unread message

Assa Yeroslaviz
Nov 10, 2015, 9:27:52 AM11/10/15
to ggplot2
I have two data frames :
TXCHROM log2FoldChange.mRNA ID.miRNA log2FoldChange.miRNA
1 chr9 -1.0119426 mmu-miR-15a-5p -0.2725025
2 chr9 -1.0119426 mmu-miR-30e-5p 0.2304548
4 chr14 -1.6593072 mmu-miR-15a-5p -0.2725025
5 chr7 0.3779362 mmu-miR-19b-3p 0.4693430
6 chr7 0.3779362 mmu-miR-9-5p -0.6406830
8 chr3 -0.4443476 mmu-miR-181a-5p -0.2239107
and
> head(target_miRNA_chr)
miRNA TXCHROM log2FoldChange.mRNA
276 mmu-miR-21a-5p chr11 2.6221773
221 mmu-miR-19b-3p chrX 0.9185626
458 mmu-miR-19b-3p chr14 0.9185626
434 mmu-miR-221-3p chrX 0.7513653
87 mmu-miR-145a-5p chr18 0.3724231
207 mmu-miR-34c-5p chr9 0.3277572
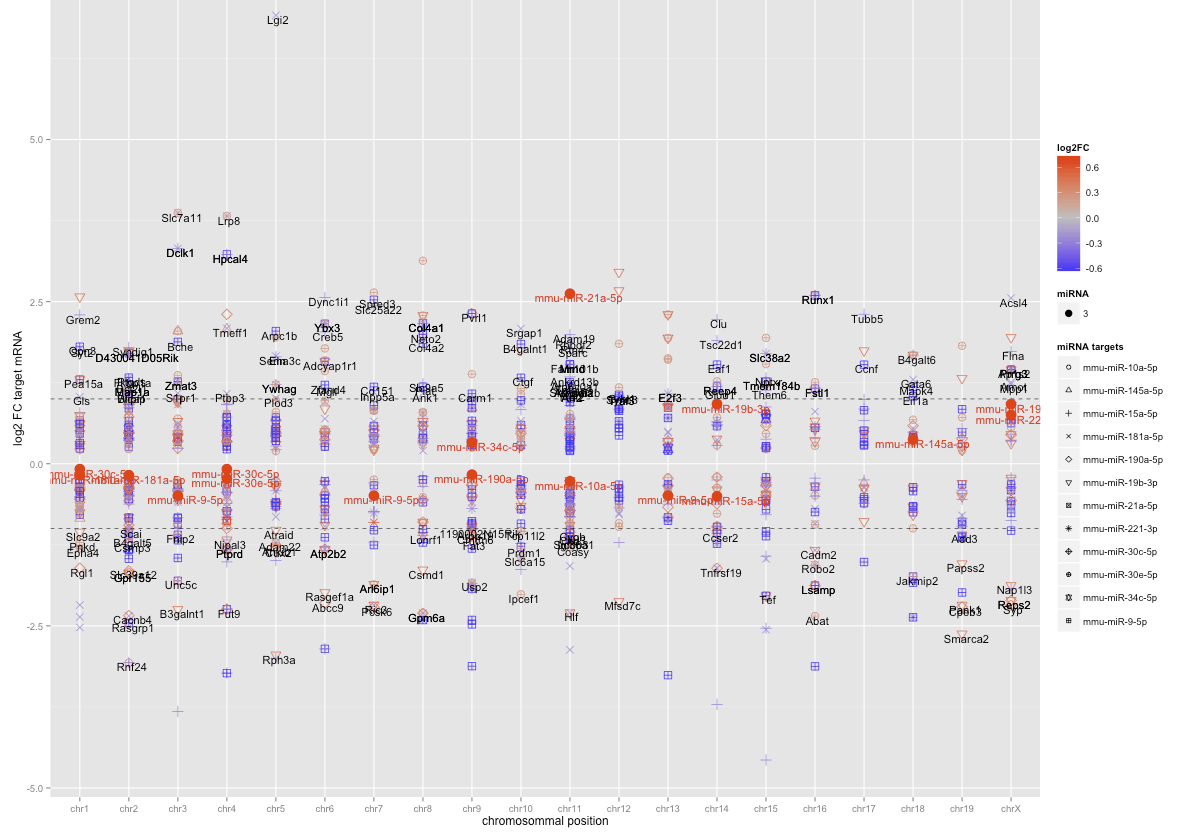
This is the script I sue to plot both data.frames into one plot.
ggplot(data=target_exp, mapping = aes(x=as.factor(TXCHROM), y=log2FoldChange.mRNA)) +
scale_shape_manual(name = "miRNA targets", values = c(1:25)) +
geom_point(data=target_exp, aes(size=3, colour=log2FoldChange.miRNA, shape=as.factor(ID.miRNA))) +
geom_hline(y=log2(2), size=0.3, linetype="dashed")+
geom_hline(y=-log2(2), size=0.3, linetype="dashed") +
scale_colour_gradient2(name = "log2FC", low="blue", mid="grey", high="red") +
geom_text(aes(label=label_gene), size=4, hjust=0.4, vjust=1, colour="black") +
ggtitle(paste(sampleID, " DEmiRNAs and their corresponding targets mRNA", sep="")) +
xlab("chromosommal position") + ylab("log2 FC target mRNA") +
# thispart adds the miRAN names to the plot in red and map them to the chromosomal localtions found in the script 1.plotmiRNA.R
geom_point(data=target_miRNA_chr, mapping=aes(y=log2FoldChange.mRNA), colour="red", size=5) +
geom_text(data =target_miRNA_chr, aes(label=miRNA), size=4, hjust=0.4, vjust=1, colour="red", guied=FALSE) +
scale_size(name="miRNA")
It all works well (see attached image), except the last commend. I would like to change the size, colour and shape in the legend of the second data.frame (miRNA). I am not really sure, why it shows me the number 3 in the legend, but I would like to have no name, the dot should be in size 5 and in a red colour.
I have tried adding the parameters size, colour and shape, but I get the error message that the parameters are not known.
I have tried to do it with the guide() command, but I am not able to tell ggplot to use it only for the second data.frame (target_miRNA_chr).
Has anyone has a suggestion how I can manipulate only a specific part of the legend?
thanks
Assa
TXCHROM log2FoldChange.mRNA ID.miRNA log2FoldChange.miRNA
1 chr9 -1.0119426 mmu-miR-15a-5p -0.2725025
2 chr9 -1.0119426 mmu-miR-30e-5p 0.2304548
4 chr14 -1.6593072 mmu-miR-15a-5p -0.2725025
5 chr7 0.3779362 mmu-miR-19b-3p 0.4693430
6 chr7 0.3779362 mmu-miR-9-5p -0.6406830
8 chr3 -0.4443476 mmu-miR-181a-5p -0.2239107
and
> head(target_miRNA_chr)
miRNA TXCHROM log2FoldChange.mRNA
276 mmu-miR-21a-5p chr11 2.6221773
221 mmu-miR-19b-3p chrX 0.9185626
458 mmu-miR-19b-3p chr14 0.9185626
434 mmu-miR-221-3p chrX 0.7513653
87 mmu-miR-145a-5p chr18 0.3724231
207 mmu-miR-34c-5p chr9 0.3277572
This is the script I sue to plot both data.frames into one plot.
ggplot(data=target_exp, mapping = aes(x=as.factor(TXCHROM), y=log2FoldChange.mRNA)) +
scale_shape_manual(name = "miRNA targets", values = c(1:25)) +
geom_point(data=target_exp, aes(size=3, colour=log2FoldChange.miRNA, shape=as.factor(ID.miRNA))) +
geom_hline(y=log2(2), size=0.3, linetype="dashed")+
geom_hline(y=-log2(2), size=0.3, linetype="dashed") +
scale_colour_gradient2(name = "log2FC", low="blue", mid="grey", high="red") +
geom_text(aes(label=label_gene), size=4, hjust=0.4, vjust=1, colour="black") +
ggtitle(paste(sampleID, " DEmiRNAs and their corresponding targets mRNA", sep="")) +
xlab("chromosommal position") + ylab("log2 FC target mRNA") +
# thispart adds the miRAN names to the plot in red and map them to the chromosomal localtions found in the script 1.plotmiRNA.R
geom_point(data=target_miRNA_chr, mapping=aes(y=log2FoldChange.mRNA), colour="red", size=5) +
geom_text(data =target_miRNA_chr, aes(label=miRNA), size=4, hjust=0.4, vjust=1, colour="red", guied=FALSE) +
scale_size(name="miRNA")
It all works well (see attached image), except the last commend. I would like to change the size, colour and shape in the legend of the second data.frame (miRNA). I am not really sure, why it shows me the number 3 in the legend, but I would like to have no name, the dot should be in size 5 and in a red colour.
I have tried adding the parameters size, colour and shape, but I get the error message that the parameters are not known.
I have tried to do it with the guide() command, but I am not able to tell ggplot to use it only for the second data.frame (target_miRNA_chr).
Has anyone has a suggestion how I can manipulate only a specific part of the legend?
thanks
Assa

Hadley Wickham
Nov 10, 2015, 10:08:50 AM11/10/15
to Assa Yeroslaviz, ggplot2
Look closely at this line:
geom_point(data=target_exp, aes(size=3, colour=log2FoldChange.miRNA, shape=as.factor(ID.miRNA)))
Hadley
--
--
You received this message because you are subscribed to the ggplot2 mailing list.
Please provide a reproducible example: https://github.com/hadley/devtools/wiki/Reproducibility
To post: email ggp...@googlegroups.com
To unsubscribe: email ggplot2+u...@googlegroups.com
More options: http://groups.google.com/group/ggplot2
---
You received this message because you are subscribed to the Google Groups "ggplot2" group.
To unsubscribe from this group and stop receiving emails from it, send an email to ggplot2+u...@googlegroups.com.
For more options, visit https://groups.google.com/d/optout.
Assa Yeroslaviz
Nov 10, 2015, 10:27:48 AM11/10/15
to ggplot2, fry...@gmail.com
Thanks Hadley,
now I know why I have the number 3 in the legend.
How do I add the second genom_point data to the legend?
I can't add any scale_shape* or scale_colour_* anymore. How can I tell guied() what I want to do?
Assa
now I know why I have the number 3 in the legend.
How do I add the second genom_point data to the legend?
I can't add any scale_shape* or scale_colour_* anymore. How can I tell guied() what I want to do?
Assa
Assa Yeroslaviz
Nov 10, 2015, 11:00:28 AM11/10/15
to ggplot2, fry...@gmail.com
Ok,
I have solved the problem by using this line:
guides(size=guide_legend(title="miRNA", override.aes = list(colour = "red"), label.theme = element_blank()))
I'm not sure, if there is a more elegant way of doing it, but it works for me now.
What I don't understand is what would have happens if I have two separate elements of type size i would have want to put in the legend. Would it be possible at all?
My question is - Is there a way to tell the guides() or the theme() command exactly which of my data sets (data.frame) in my case i wuld like to add to the legend and in what way I would like to do it?
Reply all
Reply to author
Forward
0 new messages