How do I make the y-axis intersect the x-axis at 0?
7,975 views
Skip to first unread message

Ayala Allon
Jun 14, 2016, 8:24:17 AM6/14/16
to ggplot2
Hey,
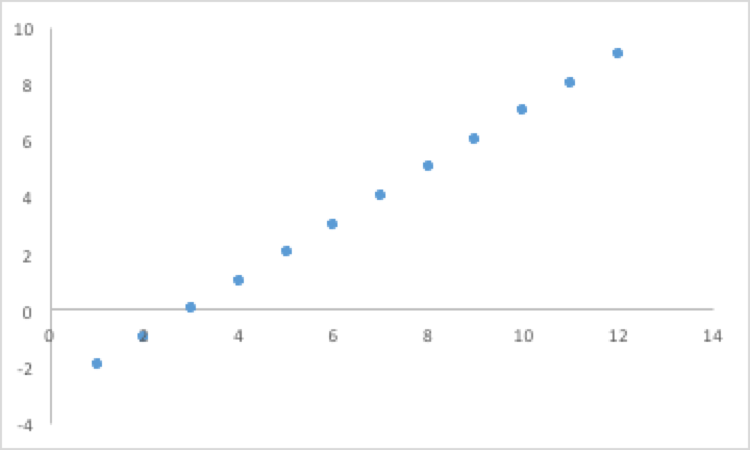
I'm trying to plot the attached graph using ggplot2 but I cannot get the y-axis intersect with the x-axis at 0 such that I would still see the points that have y values below zero. I tried playing with
expand_limits(x = 0, y = 0)scale_x_continuous(expand = c(0, 0)) + scale_y_continuous(expand = c(0, 0)
but still did not manage to get a graph like in the attached image in terms of the axes and how they intersect.
Here is the code to what I did so far
library("ggplot2")
my_data <- data.frame(a = 1:12, b = -2:9)
p <- ggplot(my_data, aes(x = a, y = b)) +
geom_point() +
geom_smooth(method = lm, se = FALSE, colour = "black", size = 0.70) +
scale_x_continuous(breaks = seq(0, 12, 1))
p <- p + theme(axis.line.x = element_line(color = "black"),
axis.line.y = element_line(colour = "black")
)
Any help will be greatly appreciated.
Thanks,
Ayala
Ayala Allon
Jun 15, 2016, 3:56:10 AM6/15/16
to ggplot2
Hey,
I will try to refine my question.
I want to get the y axis and x axis intersect at zero (i.e., (0, 0)) but that the y axis will have values below 0 (like in the graph I attached yesterday). For example the limits of the y axis will be -4-10 and the limits for the x axis will be 0-14, and that the y and x axis will intersect at (0, 0).
Any help will be greatly appreciated.
Ayala

Hadley Wickham
Jun 15, 2016, 9:44:58 AM6/15/16
to Ayala Allon, ggplot2
It is not possible to do that in ggplot2.
Hadley
> --
> --
> You received this message because you are subscribed to the ggplot2 mailing
> list.
> Please provide a reproducible example:
> https://github.com/hadley/devtools/wiki/Reproducibility
>
> To post: email ggp...@googlegroups.com
> To unsubscribe: email ggplot2+u...@googlegroups.com
> More options: http://groups.google.com/group/ggplot2
>
> ---
> You received this message because you are subscribed to the Google Groups
> "ggplot2" group.
> To unsubscribe from this group and stop receiving emails from it, send an
> email to ggplot2+u...@googlegroups.com.
> For more options, visit https://groups.google.com/d/optout.
--
http://hadley.nz
Hadley
> --
> You received this message because you are subscribed to the ggplot2 mailing
> list.
> Please provide a reproducible example:
> https://github.com/hadley/devtools/wiki/Reproducibility
>
> To post: email ggp...@googlegroups.com
> To unsubscribe: email ggplot2+u...@googlegroups.com
> More options: http://groups.google.com/group/ggplot2
>
> ---
> You received this message because you are subscribed to the Google Groups
> "ggplot2" group.
> To unsubscribe from this group and stop receiving emails from it, send an
> email to ggplot2+u...@googlegroups.com.
> For more options, visit https://groups.google.com/d/optout.
--
http://hadley.nz

sanmohan
Jun 16, 2016, 5:43:52 AM6/16/16
to ggplot2, ayala...@gmail.com
It is possible to produce a graph that is similar to what you want with a little bit of hacking. First remove all the axis lines and ticks. Then make your own axis with vertical and horizontal lines. I have made part of it to illustrate the idea. You can do the rest.
my_data <- data.frame(a = 1:12, b = -2:9)
p <- ggplot(my_data, aes(x = a, y = b)) +
geom_point() +
geom_smooth(method = lm, se = FALSE, colour = "black", size = 0.70) +
scale_x_continuous(breaks = seq(0, 12, 1))

p+theme_classic()+theme(axis.text=element_blank(),axis.ticks=element_blank(),axis.title=element_blank())+geom_hline(yintercept=0)+geom_vline(xintercept = 0)+geom_segment(aes(x=2,y=0,xend=2,yend=-.3))+geom_text(aes(x=2,y=-.5,label='2'))+geom_segment(aes(x=0,y=2,xend=-.3,yend=2))+geom_text(aes(x=-.5,y=2,label='2'))
best,
best,
Sanmohan.
sanmohan
Jun 16, 2016, 5:43:52 AM6/16/16
to ggplot2, ayala...@gmail.com
A slight modification to my previous solution: if you want the x-axis to start at 0, then you will need to use geom_segement instead of geom_hline.
my_data <- data.frame(a = 1:12, b = -2:9)
p <- ggplot(my_data, aes(x = a, y = b)) +
geom_point() +
geom_smooth(method = lm, se = FALSE, colour = "black", size = 0.70) +
scale_x_continuous(breaks = seq(0, 12, 1))
p+theme_classic()+theme(axis.text=element_blank(),axis.ticks=element_blank(),axis.title=element_blank())+geom_segment(aes(x=0,y=0,xend=12,yend=0))+geom_vline(xintercept = 0)+geom_segment(aes(x=2,y=0,xend=2,yend=-.3))+geom_text(aes(x=2,y=-.5,label='2'))+geom_segment(aes(x=0,y=2,xend=-.3,yend=2))+geom_text(aes(x=-.5,y=2,label='2'))

best,
Sanmohan.
On Wednesday, June 15, 2016 at 3:44:58 PM UTC+2, Hadley Wickham wrote:
On Wednesday, June 15, 2016 at 3:44:58 PM UTC+2, Hadley Wickham wrote:

Brian
Jun 16, 2016, 6:36:56 AM6/16/16
to sanmohan, ggplot2, ayala...@gmail.com
Hello there,
yes, along those lines one can draw everything oneself, e.g.:
my_data <- data.frame(a = 1:12, b = -2:9)
p <- ggplot(my_data, aes(x = a, y = b)) +
geom_point() +
geom_smooth(method = lm, se = FALSE, colour = "black", size = 0.70) +
scale_x_continuous(breaks = seq(0, 12, 1))
yax <- data.frame(y = seq(0, max(my_data$a), by =
floor(diff(range(my_data$a))/5)),
x = 0, xend = -0.3)
yax$yend <- yax$y
xax <- data.frame(x = seq(0, max(my_data$a), by =
floor(diff(range(my_data$b))/5)),
y = 0, yend = -0.5)
xax$xend <- xax$x
p +
theme(axis.text = element_blank(), axis.ticks = element_blank(),
axis.title = element_blank()) +
## Lines
geom_segment(aes(x = 0, y = 0, xend = max(x), yend = 0), xax) +
geom_segment(aes(x = 0, y = 0, xend = 0, yend = max(y)), yax) +
## ticks
geom_segment(aes(x = x, y = y, xend = xend, yend = yend), yax) +
geom_segment(aes(x = x, y = y, xend = xend, yend = yend), xax) +
## axis labels
geom_text(aes(x = x, y = yend + -0.3, label = x), xax) +
geom_text(aes(x = xend + -0.1, y = y, label = y), yax)
This plot looks like crap. One could package all that crap code into a
function, which is a mighty crappy idea. I am guessing there is a regent
of crapdom who holds the authority to request such crap. Crapdom needs a
new regent.
Crappy greetings
Brian
On 06/16/2016 10:05 AM, sanmohan wrote:
> A slight modification to my previous solution: if you want the x-axis to
> start at 0, then you will need to use geom_segement instead of geom_hline.
>
> my_data <- data.frame(a = 1:12, b = -2:9)
>
> p <- ggplot(my_data, aes(x = a, y = b)) +
> geom_point() +
> geom_smooth(method = lm, se = FALSE, colour = "black", size = 0.70) +
> scale_x_continuous(breaks = seq(0, 12, 1))
>
> p+theme_classic()+theme(axis.text=element_blank(),axis.ticks=element_blank(),axis.title=element_blank())+geom_segment(aes(x=0,y=0,xend=12,yend=0))+geom_vline(xintercept
> =
> 0)+geom_segment(aes(x=2,y=0,xend=2,yend=-.3))+geom_text(aes(x=2,y=-.5,label='2'))+geom_segment(aes(x=0,y=2,xend=-.3,yend=2))+geom_text(aes(x=-.5,y=2,label='2'))
>
> <https://lh3.googleusercontent.com/-YNkQcvWWFco/V2JdkoCLEnI/AAAAAAAAA_8/YoCj0sp5mQ0DZPjSItVsFTIDmQJg0tSSQCLcB/s1600/Rplot.png>
>>> To post: email ggp...@googlegroups.com <javascript:>
>>> To unsubscribe: email ggplot2+u...@googlegroups.com <javascript:>
yes, along those lines one can draw everything oneself, e.g.:
my_data <- data.frame(a = 1:12, b = -2:9)
p <- ggplot(my_data, aes(x = a, y = b)) +
geom_point() +
geom_smooth(method = lm, se = FALSE, colour = "black", size = 0.70) +
scale_x_continuous(breaks = seq(0, 12, 1))
floor(diff(range(my_data$a))/5)),
x = 0, xend = -0.3)
yax$yend <- yax$y
xax <- data.frame(x = seq(0, max(my_data$a), by =
floor(diff(range(my_data$b))/5)),
y = 0, yend = -0.5)
xax$xend <- xax$x
p +
theme(axis.text = element_blank(), axis.ticks = element_blank(),
axis.title = element_blank()) +
## Lines
geom_segment(aes(x = 0, y = 0, xend = max(x), yend = 0), xax) +
geom_segment(aes(x = 0, y = 0, xend = 0, yend = max(y)), yax) +
## ticks
geom_segment(aes(x = x, y = y, xend = xend, yend = yend), yax) +
geom_segment(aes(x = x, y = y, xend = xend, yend = yend), xax) +
## axis labels
geom_text(aes(x = x, y = yend + -0.3, label = x), xax) +
geom_text(aes(x = xend + -0.1, y = y, label = y), yax)
This plot looks like crap. One could package all that crap code into a
function, which is a mighty crappy idea. I am guessing there is a regent
of crapdom who holds the authority to request such crap. Crapdom needs a
new regent.
Crappy greetings
Brian
On 06/16/2016 10:05 AM, sanmohan wrote:
> A slight modification to my previous solution: if you want the x-axis to
> start at 0, then you will need to use geom_segement instead of geom_hline.
>
> my_data <- data.frame(a = 1:12, b = -2:9)
>
> p <- ggplot(my_data, aes(x = a, y = b)) +
> geom_point() +
> geom_smooth(method = lm, se = FALSE, colour = "black", size = 0.70) +
> scale_x_continuous(breaks = seq(0, 12, 1))
>
> p+theme_classic()+theme(axis.text=element_blank(),axis.ticks=element_blank(),axis.title=element_blank())+geom_segment(aes(x=0,y=0,xend=12,yend=0))+geom_vline(xintercept
> =
> 0)+geom_segment(aes(x=2,y=0,xend=2,yend=-.3))+geom_text(aes(x=2,y=-.5,label='2'))+geom_segment(aes(x=0,y=2,xend=-.3,yend=2))+geom_text(aes(x=-.5,y=2,label='2'))
>
>>> To unsubscribe: email ggplot2+u...@googlegroups.com <javascript:>
>>> More options: http://groups.google.com/group/ggplot2
>>>
>>> ---
>>> You received this message because you are subscribed to the Google
>> Groups
>>> "ggplot2" group.
>>> To unsubscribe from this group and stop receiving emails from it, send
>> an
>>> email to ggplot2+u...@googlegroups.com <javascript:>.
>>>
>>> ---
>>> You received this message because you are subscribed to the Google
>> Groups
>>> "ggplot2" group.
>>> To unsubscribe from this group and stop receiving emails from it, send
>> an

Joyce Robbins
Jun 16, 2016, 7:30:46 AM6/16/16
to Brian, sanmohan, ggplot2, ayala...@gmail.com
I'd say that's using a sledgehammer to swat a fly. Fwiw, here's the code in base graphics:
a <- 1:12; b <- -2:9
plot(a, b, pch = 16, col = "blue", xaxt = "n", bty = "n", xlim = c(0,14), ylim = c(-4,10), xaxs = "i")
axis(1, pos = 0)
Joyce
To unsubscribe: email ggplot2+u...@googlegroups.com
More options: http://groups.google.com/group/ggplot2
--- You received this message because you are subscribed to the Google Groups "ggplot2" group.
To unsubscribe from this group and stop receiving emails from it, send an email to ggplot2+u...@googlegroups.com.
Ayala Allon
Jun 16, 2016, 7:34:25 AM6/16/16
to sanmohan, ggplot2
Hey Sanmohan,
Thank you so much! I used your solution and it is great!
Thank you again
Best,
Ayala
--
Ayala Allon, PhD Candidate
The Visual Working Memory Lab
School of Psychological Sciences
Tel-Aviv University
Reply all
Reply to author
Forward
0 new messages