How can I modify the grid like this
77 views
Skip to first unread message

Pet Chiang
Jul 14, 2017, 4:15:51 PM7/14/17
to ggplot2
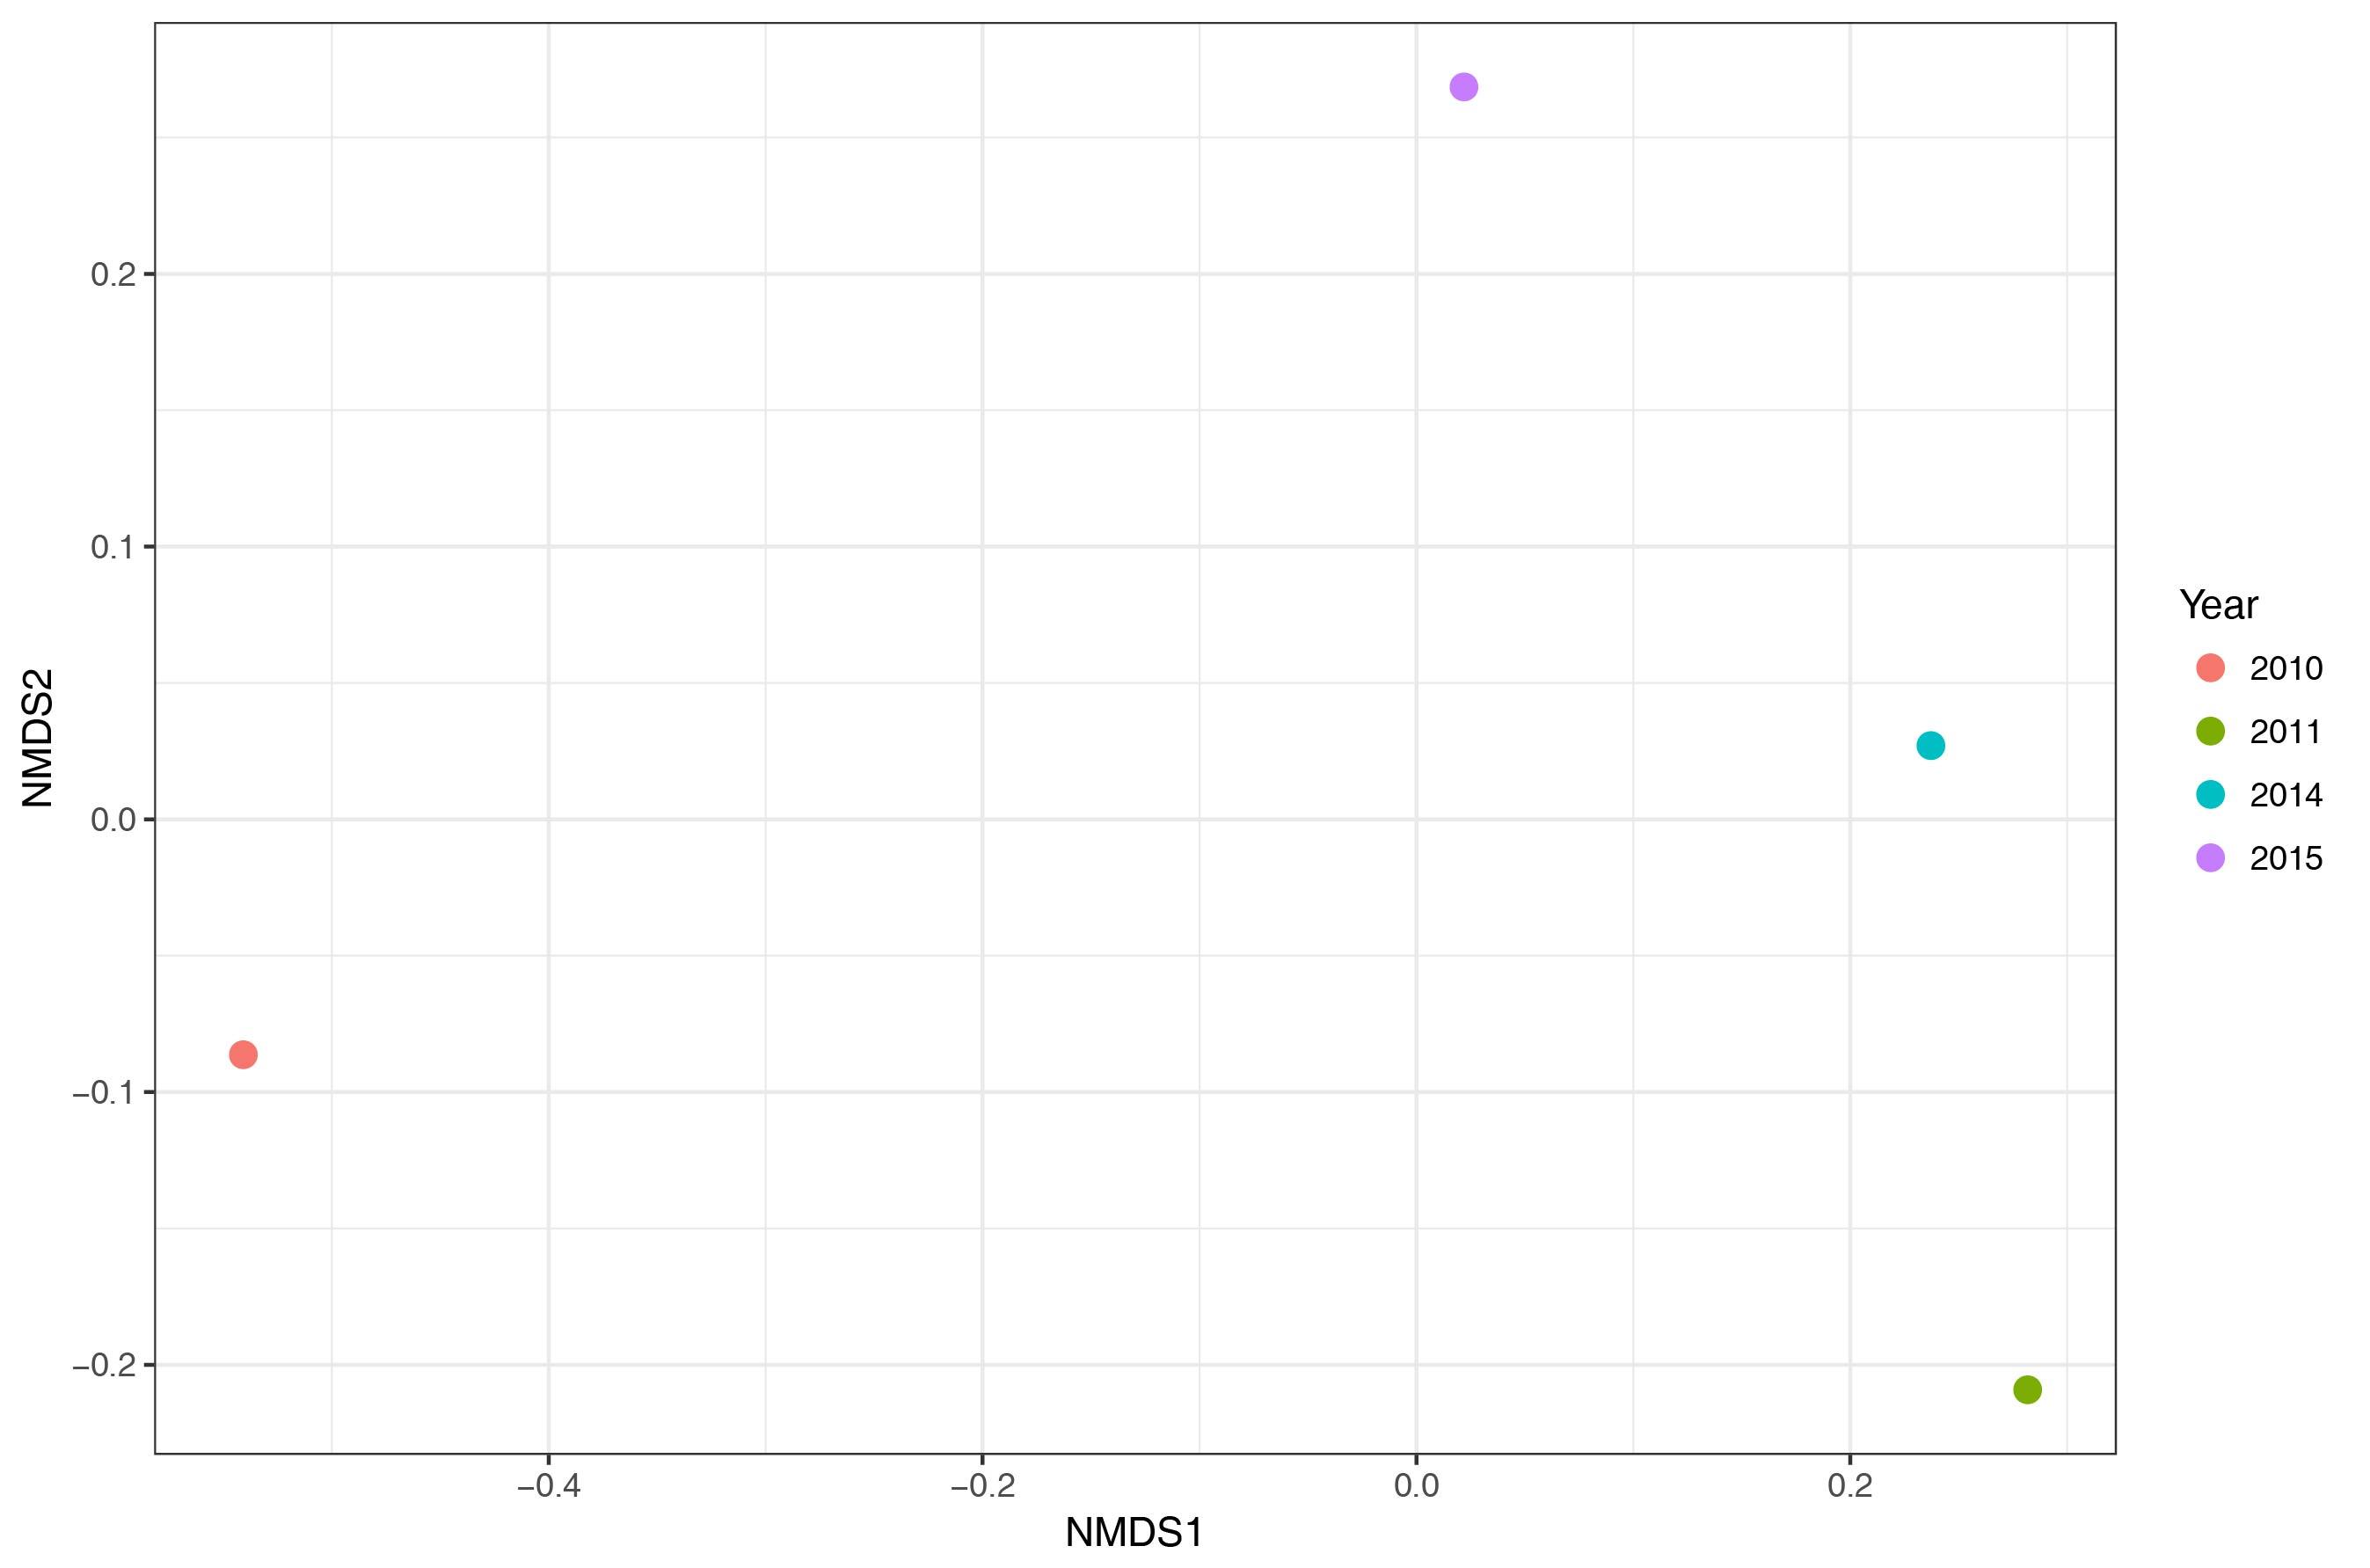
Hi, I build an NMDS plot. Here is scripts
p<-ggplot()
p<-p+geom_point(data=df,aes(NMDS1,NMDS2,colour=Year),size=3)
p<-p+theme_bw()
This give a plot (see original.jpg)
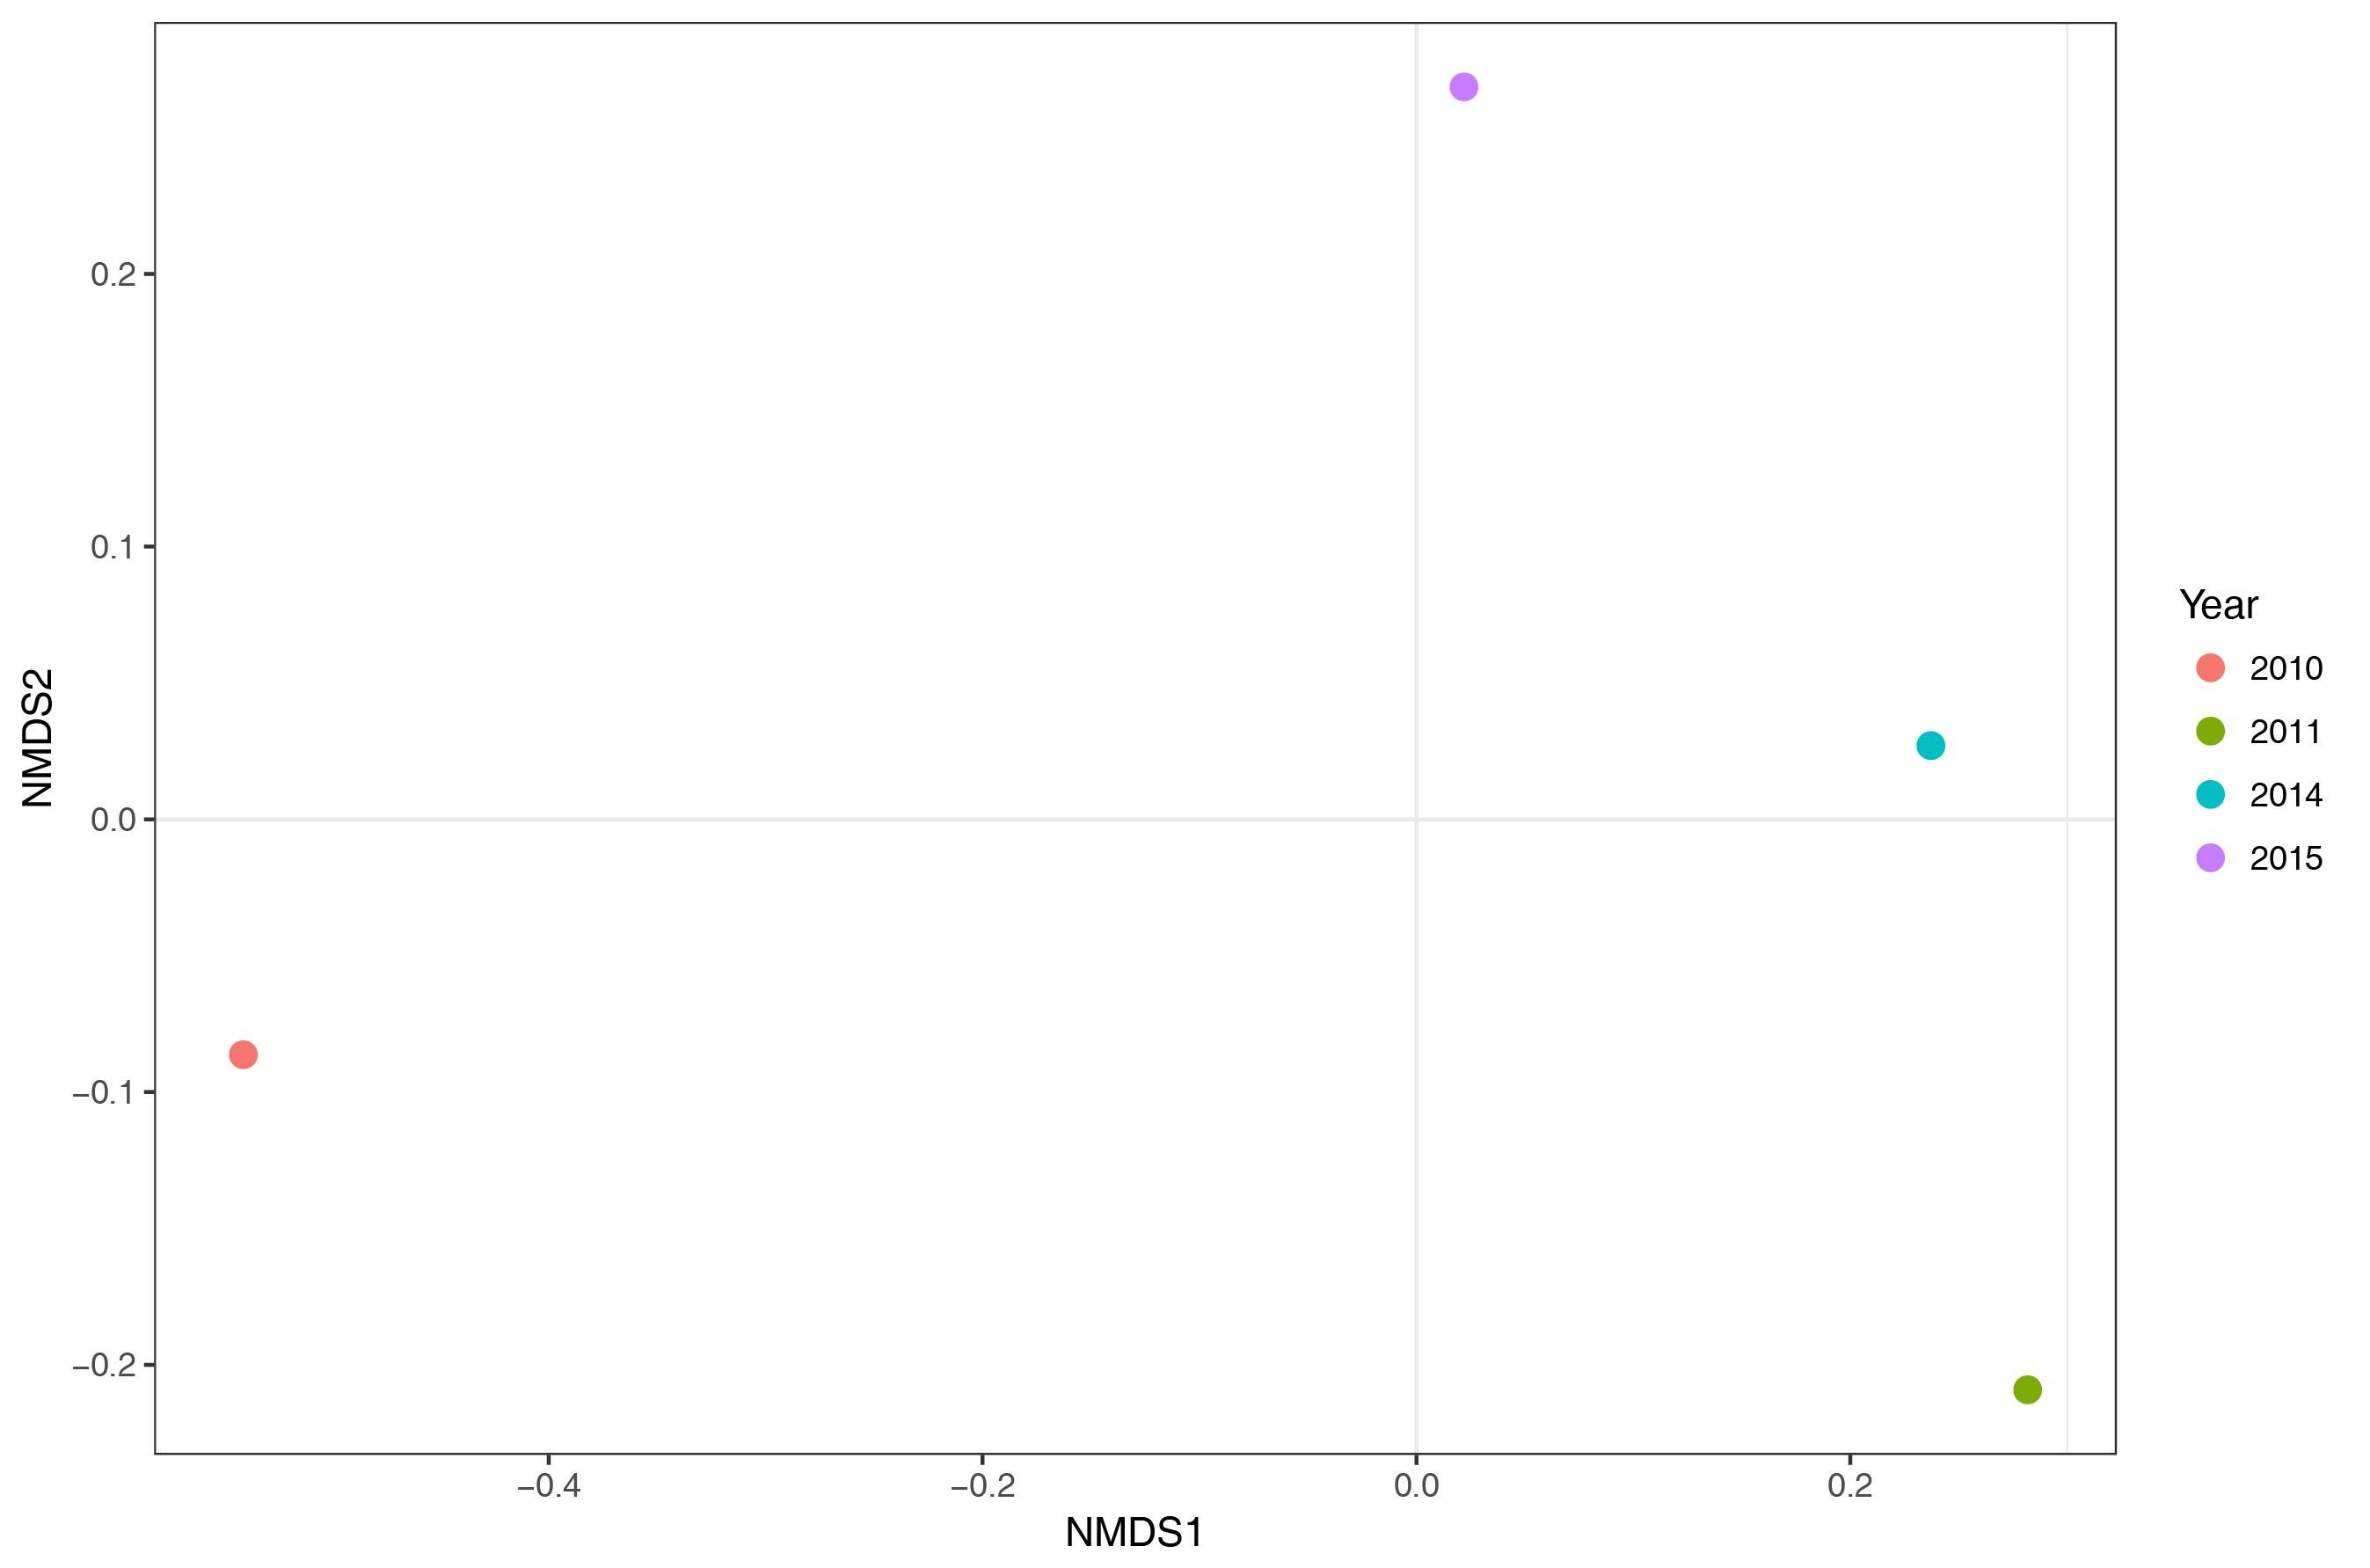
I only want to show the two grid lines (see, the attached file revised.jpg). These tow lines are at (0,0). For now, I can only use the illustrator to edit the R plot. Is there any way I can write codes and decide which grid lines show up.
Thanks,
Ben
p<-ggplot()
p<-p+geom_point(data=df,aes(NMDS1,NMDS2,colour=Year),size=3)
p<-p+theme_bw()
This give a plot (see original.jpg)
I only want to show the two grid lines (see, the attached file revised.jpg). These tow lines are at (0,0). For now, I can only use the illustrator to edit the R plot. Is there any way I can write codes and decide which grid lines show up.
Thanks,
Ben

Olivia
Aug 21, 2017, 4:47:25 PM8/21/17
to ggplot2
If you had provided a reproducible example it would be easier to provide code that might help, but you can consider using geom_hline(yintercept = 0) and geom_vline(xintercept = 0) with some modification of linetype and colour of line as you like. See ?geom_hline. You can remove the existing gridlines with p + theme(panel.grid = element_blank()).
Olivia
Reply all
Reply to author
Forward
0 new messages