Specifying lower limits of a facetted plot with scale="free" in ggplot2
23 views
Skip to first unread message

Kendra Millard
May 14, 2018, 3:45:34 PM5/14/18
to ggplot2
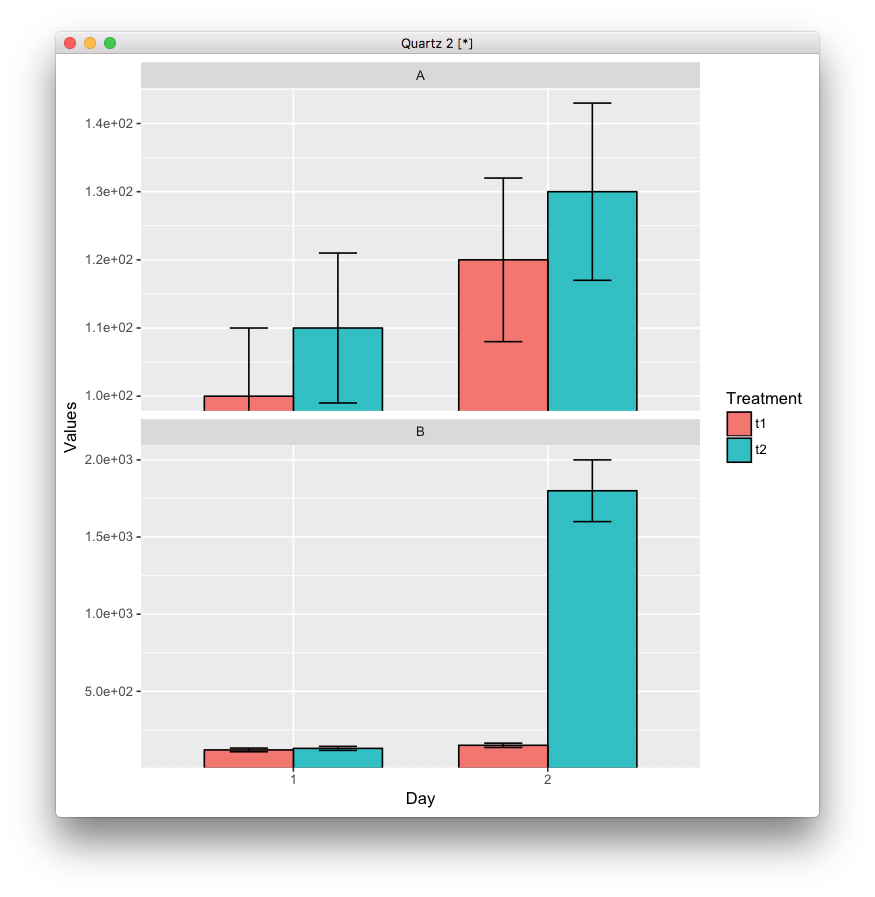
df <- data.frame(Taxa=c(rep("A", 4), rep("B", 4)),
Day=as.factor(c(1,1,2,2,1,1,2,2)),
Treatment=c(rep(c("t1","t2"),4)),
Values=c(100,110,120,130, 120, 130,150, 1800),
SD = c(10,11,12,13,12,13,14,200)) # i have one big outlier in the data
library(ggplot2)
p1 <- ggplot(df, aes(x=Day, ymax=Values+SD, ymin=Values-SD, y=Values, fill=Treatment))+
geom_bar(stat="identity", position=position_dodge(width=0.7), col="black", width=0.7) +
facet_wrap(~Taxa, scale="free_y", nrow=2) +
scale_y_continuous(labels = scales::scientific) +
geom_errorbar(position=position_dodge(width=0.7), col="black", lty="solid", width=0.3)
p1
i tried:
p1 + expand_limits(ylim = c(100, NA)) # is ignored
p1 + scale_y_continuous(labels = scales::scientific, limits = c(100, NA)) # removes geom_bar
p1 + coord_cartesian(ylim=100,NA) # error
I have been asked to start a similar, but more complex plot at a fixed y-value, but let ggplot calculate the x-max individually for each facet. But with `scale="free_y"` is seems to be impossible. Since i have this one big outlier, i do not want to control the ymax globally. Is there a way to achieve this, without plotting all Taxa individually?
At SO, it was suggested to tinker around with y-values to shift the the bar baseline:
https://stackoverflow.com/questions/35324892/ggplot2-setting-geom-bar-baseline-to-1-instead-of-zero
But this does not work with scales::scientific in the scale_y_continous call.

Brandon Hurr
May 14, 2018, 6:35:39 PM5/14/18
to kendr...@gmail.com, ggplot2
p1 + scale_y_continuous(labels = scales::scientific, limits=c(100, NA), oob = scales::rescale_none)
From: https://stackoverflow.com/questions/10365167/geom-bar-bars-not-displaying-when-specifying-ylim--
--
You received this message because you are subscribed to the ggplot2 mailing list.
Please provide a reproducible example: https://github.com/hadley/devtools/wiki/Reproducibility
To post: email ggp...@googlegroups.com
To unsubscribe: email ggplot2+u...@googlegroups.com
More options: http://groups.google.com/group/ggplot2
---
You received this message because you are subscribed to the Google Groups "ggplot2" group.
To unsubscribe from this group and stop receiving emails from it, send an email to ggplot2+u...@googlegroups.com.
For more options, visit https://groups.google.com/d/optout.
Reply all
Reply to author
Forward
0 new messages