Problem with setting number of colours showing using scale_fill_gradientn and guide_colorbar
61 views
Skip to first unread message

Ka Ming Fung
Jan 24, 2018, 5:52:08 AM1/24/18
to ggplot2
Hey guys,
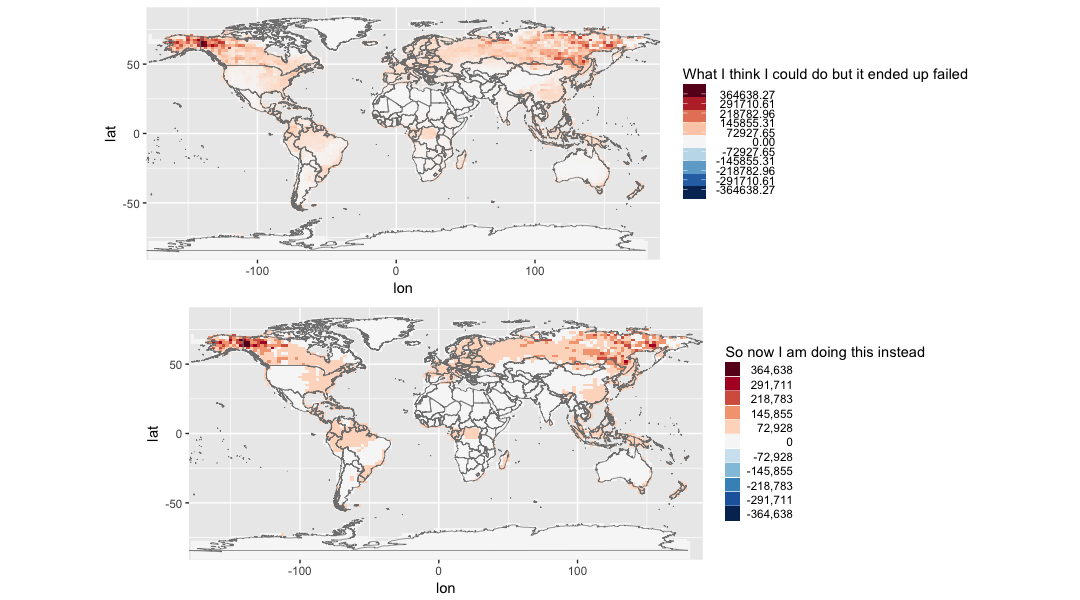
I have a data frame with a list of lon, lat and continuous values. I want to make the color bar with 6 colors like this:

So I tried the following codes:
scale_fill_gradientn(colours = rev(colorRampPalette(brewer.pal(11,"RdBu"))(11)[6:11],
breaks = data.breaks
guide = guide_colorbar(title = legend.unit,
nbin = 6, raster = F))
But what I got is a color bar with 7 color, like this,

Would you please advise how I could get a color bar with 6 colors?
Thanks a lot. It has been troubled me for a long time and my temporary solution is to transform the continuous data to some discrete values and plot them with discrete color legend.
Regards,
fkm

Adriano Fantini
Jan 24, 2018, 6:01:03 AM1/24/18
to Ka Ming Fung, ggplot2
You seem to be using continuous values, you should definitely factorize those values if you want a discrete scale, that 's what ggplot expects of you at least. So cut them with cut, and assign a label to each bin... something along these lines:
Adriano Fantini
--
--
You received this message because you are subscribed to the ggplot2 mailing list.
Please provide a reproducible example: https://github.com/hadley/devtools/wiki/Reproducibility
To post: email ggp...@googlegroups.com
To unsubscribe: email ggplot2+unsubscribe@googlegroups.com
More options: http://groups.google.com/group/ggplot2
---
You received this message because you are subscribed to the Google Groups "ggplot2" group.
To unsubscribe from this group and stop receiving emails from it, send an email to ggplot2+unsubscribe@googlegroups.com.
For more options, visit https://groups.google.com/d/optout.
FUNG, Ka Ming
Jan 24, 2018, 9:25:55 AM1/24/18
to Adriano Fantini, ggplot2
Dear Adriano,
I would like to have a continuous scale with specified number of color.
Thanks for your suggestions. I am using the same method as a temporary solution to create the “color bar” I want. I wonder if there is right way to set the number of colors (aka nbin?) in ggplot2, so that my setting won’t get overrided.
Regards,
Fkm
On Wed, 24 Jan 2018 at 06:00, Adriano Fantini <adr.f...@gmail.com> wrote:
You seem to be using continuous values, you should definitely factorize those values if you want a discrete scale, that 's what ggplot expects of you at least. So cut them with cut, and assign a label to each bin... something along these lines:Adriano Fantini2018-01-24 6:49 GMT+01:00 Ka Ming Fung <fkm...@gmail.com>:Hey guys,I have a data frame with a list of lon, lat and continuous values. I want to make the color bar with 6 colors like this:
So I tried the following codes:scale_fill_gradientn(colours = rev(colorRampPalette(brewer.pal(11,"RdBu"))(11)[6:11],
breaks = data.breaksguide = guide_colorbar(title = legend.unit,
nbin = 6, raster = F))But what I got is a color bar with 7 color, like this,
Would you please advise how I could get a color bar with 6 colors?
Thanks a lot. It has been troubled me for a long time and my temporary solution is to transform the continuous data to some discrete values and plot them with discrete color legend.
Regards,
fkm
--
--
You received this message because you are subscribed to the ggplot2 mailing list.
Please provide a reproducible example: https://github.com/hadley/devtools/wiki/Reproducibility
To post: email ggp...@googlegroups.com
To unsubscribe: email ggplot2+u...@googlegroups.com
More options: http://groups.google.com/group/ggplot2
---
You received this message because you are subscribed to the Google Groups "ggplot2" group.
To unsubscribe from this group and stop receiving emails from it, send an email to ggplot2+u...@googlegroups.com.
Adriano Fantini
Jan 24, 2018, 10:48:49 AM1/24/18
to FUNG, Ka Ming, ggplot2
I do not understand what you mean with "a continuous scale with specified number of color". Looks like a discrete scale to me. The scale you showed in the first list looks discrete as well.
Cheers,
AF
Adriano Fantini
To unsubscribe: email ggplot2+unsubscribe@googlegroups.com
More options: http://groups.google.com/group/ggplot2
---
You received this message because you are subscribed to the Google Groups "ggplot2" group.
To unsubscribe from this group and stop receiving emails from it, send an email to ggplot2+unsubscribe@googlegroups.com.
FUNG, Ka Ming
Jan 24, 2018, 10:58:08 AM1/24/18
to Adriano Fantini, ggplot2
Dear Adriano,
The first figure I showed is a discrete scale, but I want to make a continuous scale that looks like a discrete one. It is because, for a heat map like the one below (from Saikawa et al. (2013)), readers would find it easier to associate colors on grids on the map with color and values in the scale bar, than with a continuous color scale with many shades of colors.
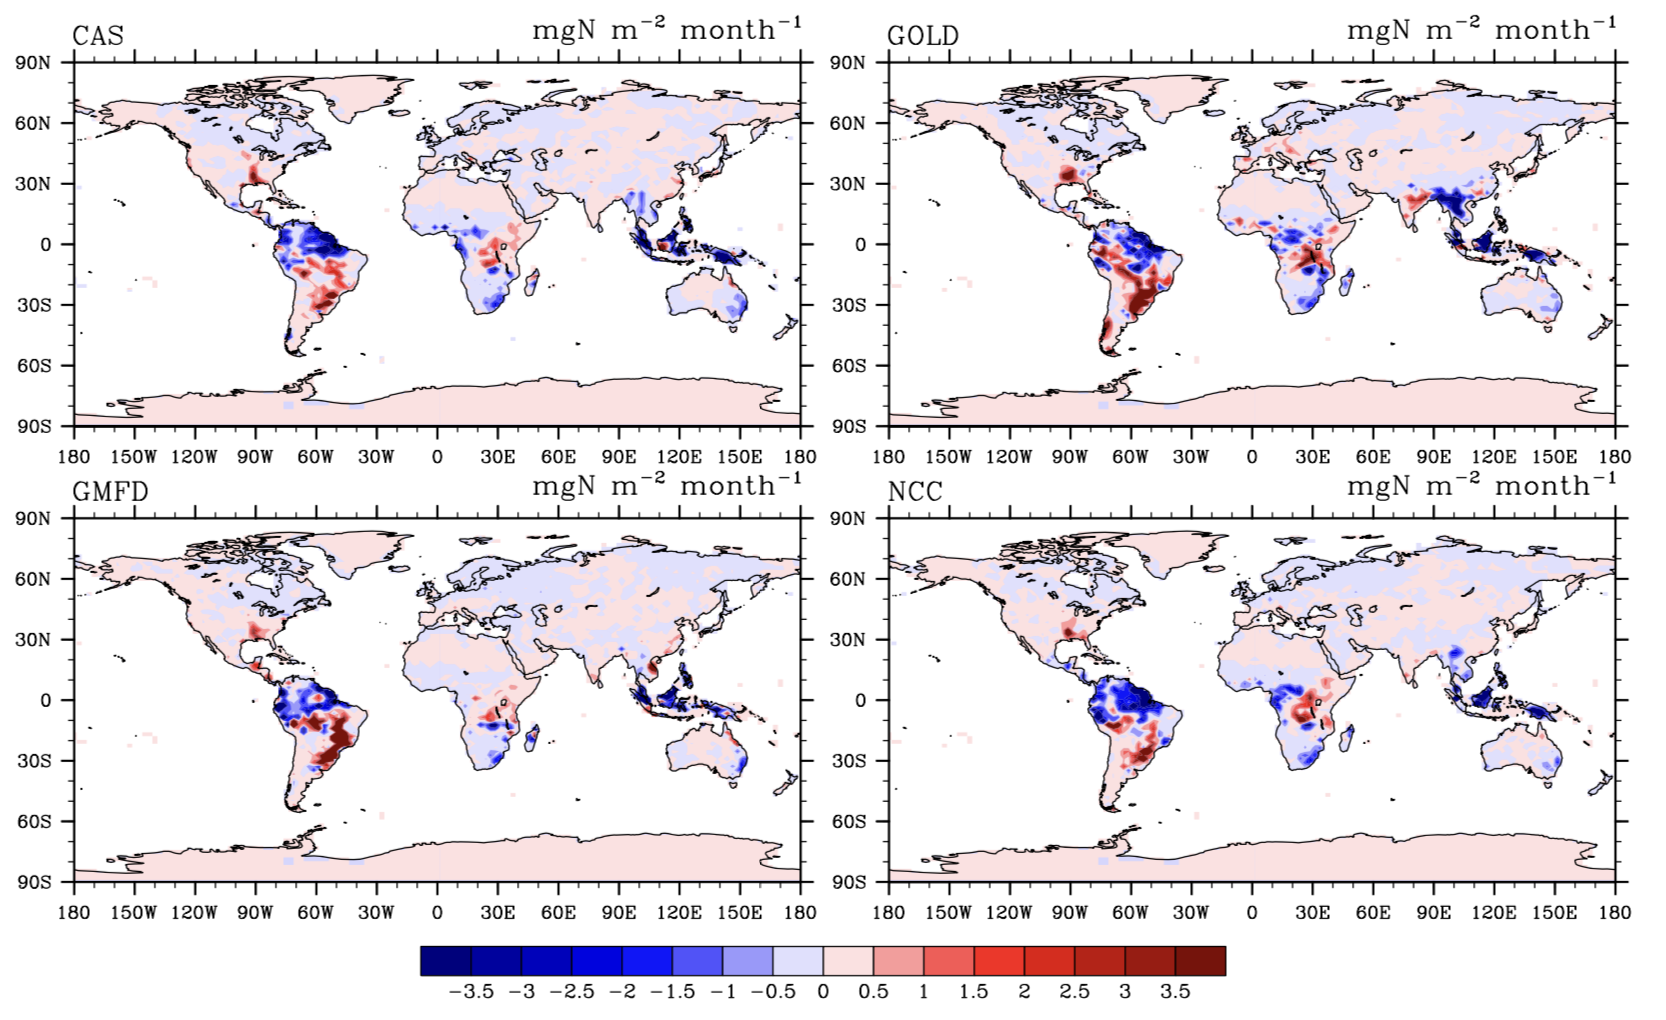
I hope it helps to explain my motive for looking for a way to control the number of shades of colors precisely in a color bar.
Thanks,
fkm
Adriano Fantini
Jan 25, 2018, 4:04:55 AM1/25/18
to FUNG, Ka Ming, ggplot2
I would argue that the one you just showed is not a continuous scale that looks like a discrete one but quite the opposite: a discrete scales with values so close that it looks like a continuous one. I think that's the way you should approach this. If you however insist in trying to use a continuous scale: can you provide your dataset, or an example dataset, so that one can test?
Adriano Fantini
FUNG, Ka Ming
Jan 25, 2018, 1:39:13 PM1/25/18
to Adriano Fantini, ggplot2
Dear Adriano,
Thank you for your reply. Anyway, what I wonder is if there is a way to restrict the number of colors used in a colorbar of ggplot2. Attached please find my sample codes, data, and plots for your testing.
Thanks again for your patience and help.
Regards,
fkm

Brandon Hurr
Jan 25, 2018, 2:23:33 PM1/25/18
to FUNG, Ka Ming, Adriano Fantini, ggplot2
What version are you using?
I get 11 colors. 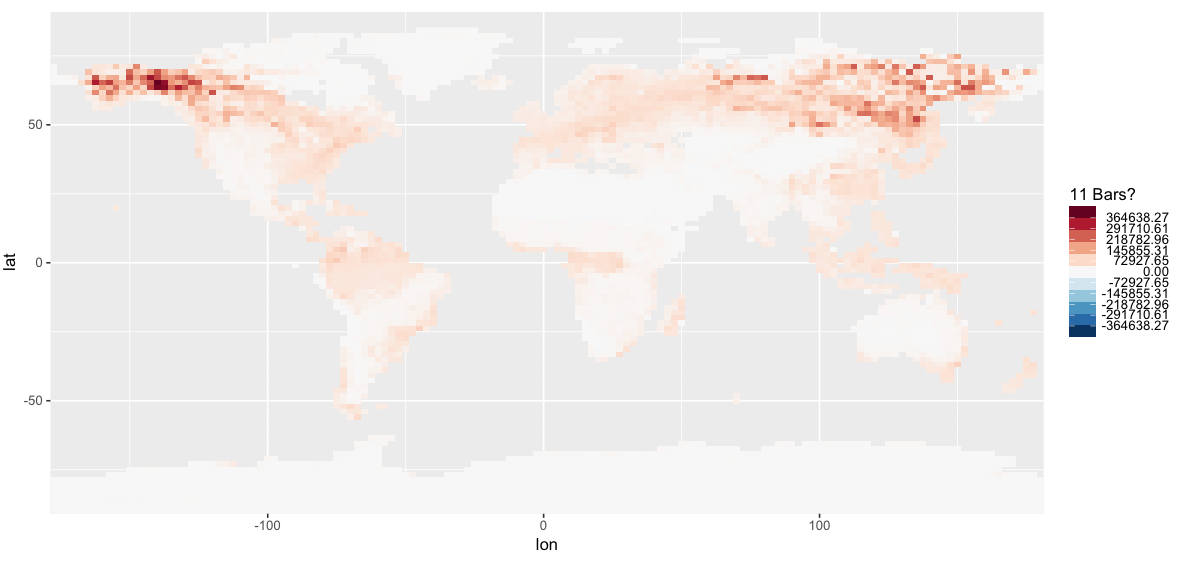
ggplot(data = plot.data, mapping = aes(x = lon, y = lat)) +
coord_fixed(expand = FALSE) +
theme(legend.justification = c(0,0.5),
legend.text.align = 1) +
geom_raster(aes(fill = value), interpolate = F) +
scale_fill_gradientn(colors = rev(colorRampPalette(brewer.pal(11,"RdBu"))(11)),
na.value = NA,
breaks = data.labs,
limits = c(-zlim, zlim),
guide = guide_colorbar(title = "11 Bars?",
raster = FALSE,
nbin = 11)
)
> devtools::session_info()
Session info -------------------------------------------------------------------------------------------------
setting value
version R version 3.4.2 (2017-09-28)
system x86_64, darwin15.6.0
ui AQUA
language (EN)
collate en_US.UTF-8
tz America/Los_Angeles
date 2018-01-25
Packages -----------------------------------------------------------------------------------------------------
package * version date source
assertthat 0.2.0 2017-04-11 CRAN (R 3.4.0)
base * 3.4.2 2017-10-04 local
bindr 0.1 2016-11-13 cran (@0.1)
bindrcpp 0.2 2017-06-17 cran (@0.2)
colorspace 1.3-2 2016-12-14 CRAN (R 3.4.0)
compiler 3.4.2 2017-10-04 local
datasets * 3.4.2 2017-10-04 local
devtools 1.13.0 2017-05-08 CRAN (R 3.4.0)
digest 0.6.13 2017-12-14 cran (@0.6.13)
dplyr 0.7.4.9000 2018-01-15 Github (tidyverse/dplyr@f49115b)
ggplot2 * 2.2.1.9000 2018-01-15 Github (tidyverse/ggplot2@bf9255e)
ggpubr * 0.1.6 2017-11-14 CRAN (R 3.4.2)
glue 1.2.0 2017-10-29 cran (@1.2.0)
graphics * 3.4.2 2017-10-04 local
grDevices * 3.4.2 2017-10-04 local
grid 3.4.2 2017-10-04 local
gtable 0.2.0 2016-02-26 CRAN (R 3.4.0)
labeling 0.3 2014-08-23 CRAN (R 3.4.0)
lazyeval 0.2.1 2017-10-29 cran (@0.2.1)
magrittr * 1.5 2014-11-22 CRAN (R 3.4.0)
memoise 1.1.0 2017-04-21 CRAN (R 3.4.0)
methods * 3.4.2 2017-10-04 local
munsell 0.4.3 2016-02-13 CRAN (R 3.4.0)
pkgconfig 2.0.1 2017-03-21 cran (@2.0.1)
plyr 1.8.4 2016-06-08 CRAN (R 3.4.0)
purrr 0.2.4.9000 2017-11-28 Github (tidyverse/purrr@62b135a)
R6 2.2.2 2017-06-17 cran (@2.2.2)
RColorBrewer * 1.1-2 2014-12-07 CRAN (R 3.4.0)
Rcpp 0.12.14 2017-11-23 cran (@0.12.14)
rlang 0.1.6.9003 2018-01-15 Github (tidyverse/rlang@e41652d)
scales 0.5.0.9000 2017-10-10 Github (hadley/scales@d767915)
stats * 3.4.2 2017-10-04 local
tibble 1.3.4 2017-08-22 cran (@1.3.4)
tidyselect 0.2.3 2017-11-06 cran (@0.2.3)
tools 3.4.2 2017-10-04 local
utils * 3.4.2 2017-10-04 local
withr 2.1.1.9000 2018-01-15 Github (jimhester/withr@df18523)
FUNG, Ka Ming
Jan 25, 2018, 2:38:18 PM1/25/18
to Brandon Hurr, Adriano Fantini, ggplot2
Dear Brandon,
Still 9 colors only after updating all packages. Here comes my session info. Thanks.
> devtools::session_info()
Session info ---------------------------------------------------------------------------------------------------
setting value
version R version 3.4.3 (2017-11-30)
system x86_64, darwin15.6.0
ui RStudio (1.1.383)
language (EN)
collate en_US.UTF-8
tz America/New_York
date 2018-01-25
Packages -------------------------------------------------------------------------------------------------------
package * version date source
assertthat 0.2.0 2017-04-11 CRAN (R 3.4.0)
base * 3.4.3 2017-12-07 local
bindr 0.1 2016-11-13 CRAN (R 3.4.0)
bindrcpp 0.2 2017-06-17 CRAN (R 3.4.0)
broom 0.4.3 2017-11-20 CRAN (R 3.4.3)
cellranger 1.1.0 2016-07-27 CRAN (R 3.4.0)
cli 1.0.0 2017-11-05 CRAN (R 3.4.2)
colorspace 1.3-2 2016-12-14 CRAN (R 3.4.0)
compiler 3.4.3 2017-12-07 local
cowplot 0.9.2 2017-12-17 CRAN (R 3.4.3)
crayon 1.3.4 2017-09-16 CRAN (R 3.4.1)
datasets * 3.4.3 2017-12-07 local
devtools 1.13.4 2017-11-09 CRAN (R 3.4.2)
digest 0.6.14 2018-01-14 CRAN (R 3.4.3)
dplyr * 0.7.4 2017-09-28 CRAN (R 3.4.2)
forcats * 0.2.0 2017-01-23 CRAN (R 3.4.0)
foreign 0.8-69 2017-06-22 CRAN (R 3.4.3)
ggplot2 * 2.2.1 2016-12-30 CRAN (R 3.4.0)
ggpubr * 0.1.6 2017-11-14 CRAN (R 3.4.2)
glue 1.2.0 2017-10-29 CRAN (R 3.4.2)
graphics * 3.4.3 2017-12-07 local
grDevices * 3.4.3 2017-12-07 local
grid 3.4.3 2017-12-07 local
gtable 0.2.0 2016-02-26 CRAN (R 3.4.0)
haven 1.1.1 2018-01-18 CRAN (R 3.4.3)
hms 0.4.1 2018-01-24 CRAN (R 3.4.3)
httr 1.3.1 2017-08-20 CRAN (R 3.4.1)
jsonlite 1.5 2017-06-01 CRAN (R 3.4.0)
labeling 0.3 2014-08-23 CRAN (R 3.4.0)
lattice 0.20-35 2017-03-25 CRAN (R 3.4.3)
lazyeval 0.2.1 2017-10-29 CRAN (R 3.4.2)
lubridate 1.7.1 2017-11-03 CRAN (R 3.4.2)
magrittr * 1.5 2014-11-22 CRAN (R 3.4.0)
maps * 3.2.0 2017-06-08 CRAN (R 3.4.0)
memoise 1.1.0 2017-04-21 CRAN (R 3.4.0)
methods * 3.4.3 2017-12-07 local
mnormt 1.5-5 2016-10-15 CRAN (R 3.4.0)
modelr 0.1.1 2017-07-24 CRAN (R 3.4.1)
munsell 0.4.3 2016-02-13 CRAN (R 3.4.0)
nlme 3.1-131 2017-02-06 CRAN (R 3.4.3)
parallel 3.4.3 2017-12-07 local
pillar 1.1.0 2018-01-14 CRAN (R 3.4.3)
pkgconfig 2.0.1 2017-03-21 CRAN (R 3.4.0)
plyr 1.8.4 2016-06-08 CRAN (R 3.4.0)
psych 1.7.8 2017-09-09 CRAN (R 3.4.3)
purrr * 0.2.4 2017-10-18 CRAN (R 3.4.2)
R6 2.2.2 2017-06-17 CRAN (R 3.4.0)
RColorBrewer * 1.1-2 2014-12-07 CRAN (R 3.4.0)
Rcpp 0.12.15 2018-01-20 CRAN (R 3.4.3)
readr * 1.1.1 2017-05-16 CRAN (R 3.4.0)
readxl 1.0.0 2017-04-18 CRAN (R 3.4.0)
reshape2 1.4.3 2017-12-11 CRAN (R 3.4.3)
rlang 0.1.6 2017-12-21 CRAN (R 3.4.3)
rstudioapi 0.7 2017-09-07 CRAN (R 3.4.1)
rvest 0.3.2 2016-06-17 CRAN (R 3.4.0)
scales 0.5.0 2017-08-24 CRAN (R 3.4.1)
stats * 3.4.3 2017-12-07 local
stringi 1.1.6 2017-11-17 CRAN (R 3.4.2)
stringr * 1.2.0 2017-02-18 CRAN (R 3.4.0)
tibble * 1.4.2 2018-01-22 CRAN (R 3.4.3)
tidyr * 0.7.2 2017-10-16 CRAN (R 3.4.2)
tidyverse * 1.2.1 2017-11-14 CRAN (R 3.4.2)
tools 3.4.3 2017-12-07 local
utils * 3.4.3 2017-12-07 local
withr 2.1.1 2017-12-19 CRAN (R 3.4.3)
xml2 1.2.0 2018-01-24 CRAN (R 3.4.3)
yaml 2.1.16 2017-12-12 CRAN (R 3.4.3)
Regards,
fkm
Brandon Hurr
Jan 25, 2018, 2:41:34 PM1/25/18
to FUNG, Ka Ming, Adriano Fantini, ggplot2
maybe try this:
devtools::dev_mode()FUNG, Ka Ming
Jan 25, 2018, 3:06:18 PM1/25/18
to Brandon Hurr, Adriano Fantini, ggplot2
Dear Brandon,
I got 11 colors now. Thank you so much for all of your replies.
I followed the method mentioned here at https://gist.github.com/kohske/1150934 to install the dev version of ggplot2.
Regards,
fkm
Reply all
Reply to author
Forward
0 new messages