ggplot is varying the stacking order of bars within a single facet

eipi10
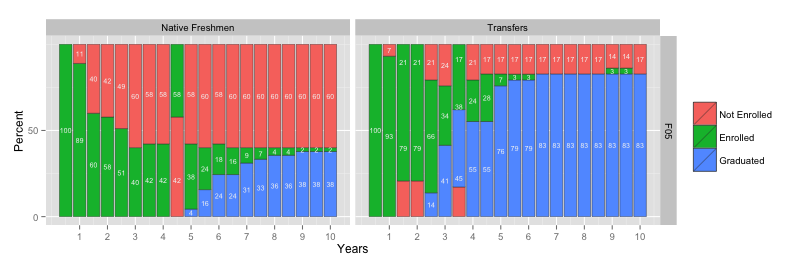
I'm having a weird (to me at least) problem in which ggplot is varying the order in which bars are stacked within a facet. The picture below shows what is going on. Reproducible code follows. In the image below, the bars should be stacked with blue on the bottom, followed by green, followed by red on top (just as in the legend), and most of them are indeed stacked in this order. However, notice in the left facet that the bar at 4.5 years is stacked in a different order, with red on the bottom, followed by green. In the right facet, the bars at 1.5, 2, and 3.5 years are stacked in the wrong order as well. Also note that even though some of the bars are stacked incorrectly, the text values that go with each bar are in the correct locations. The fill variable ("pst.flg" in the code below) is a factor, which should (and in my previous experience does) result in the bars being stacked in order of the factor levels. I can't remember ever seeing variable stacking order within a facet like this.
Here's the code to reproduce the graph. Data is at the bottom of this message.
ggplot(dat1, aes(years, pct, fill=pst.flg)) +
geom_bar(stat="identity", colour='grey20', lwd=0.2) +
geom_text(aes(label=round(pct), y=pct.pos, colour=pst.flg), size=2.5, colour="grey95") +
facet_grid(coh.termAbbr ~ coh) +
scale_x_continuous(breaks=seq(1,10,1)) +
scale_y_continuous(breaks=c(0,50)) +
labs(fill="", x="Years", y="Percent") +
scale_fill_manual(name="",breaks=c("Not Enrolled","Enrolled","Graduated"),
values=hcl(seq(375,15, length.out=4)[-1], 100, 65))
Another strange thing: If instead of "dat1" I sort the data first (ggplot(dat1 %>% arrange(years, pst.flg), etc.), then all the bars come out stacked in the proper order. This doesn't solve my problem, because in my full data set, using arrange() doesn't solve the stacking problem.
Does anyone have an idea of what could be causing this and how to fix it?
Thanks,
Joel
dat1 = structure(list(coh = structure(c(2L, 2L, 2L, 2L, 2L, 2L, 2L,
1L, 1L, 1L, 1L, 1L, 2L, 1L, 1L, 1L, 1L, 1L, 1L, 1L, 1L, 1L, 1L,
1L, 1L, 1L, 1L, 1L, 1L, 1L, 1L, 1L, 1L, 1L, 1L, 1L, 1L, 1L, 1L,
1L, 1L, 1L, 1L, 1L, 1L, 1L, 1L, 1L, 1L, 1L, 1L, 1L, 1L, 1L, 1L,
1L, 1L, 1L, 2L, 2L, 2L, 2L, 2L, 2L, 2L, 2L, 2L, 2L, 2L, 2L, 2L,
2L, 2L, 2L, 2L, 2L, 2L, 2L, 2L, 2L, 2L, 2L, 2L, 2L, 2L, 2L, 2L,
2L, 2L, 2L, 2L, 2L, 2L, 2L, 2L, 2L, 2L, 2L, 2L), .Label = c("Native Freshmen",
"Transfers"), class = "factor"), coh.termAbbr = structure(c(1L,
1L, 1L, 1L, 1L, 1L, 1L, 1L, 1L, 1L, 1L, 1L, 1L, 1L, 1L, 1L, 1L,
1L, 1L, 1L, 1L, 1L, 1L, 1L, 1L, 1L, 1L, 1L, 1L, 1L, 1L, 1L, 1L,
1L, 1L, 1L, 1L, 1L, 1L, 1L, 1L, 1L, 1L, 1L, 1L, 1L, 1L, 1L, 1L,
1L, 1L, 1L, 1L, 1L, 1L, 1L, 1L, 1L, 1L, 1L, 1L, 1L, 1L, 1L, 1L,
1L, 1L, 1L, 1L, 1L, 1L, 1L, 1L, 1L, 1L, 1L, 1L, 1L, 1L, 1L, 1L,
1L, 1L, 1L, 1L, 1L, 1L, 1L, 1L, 1L, 1L, 1L, 1L, 1L, 1L, 1L, 1L,
1L, 1L), .Label = c("F05", "S06", "F06", "S07", "F07", "S08",
"F08", "S09", "F09", "S10", "F10", "S11", "F11", "S12", "F12",
"S13", "F13", "S14", "F14", "S15", "F15"), class = c("ordered",
"factor")), years = c(2, 2.5, 1.5, 2, 1, 1, 1.5, 1.5, 1.5, 2,
2, 2.5, 0.5, 0.5, 1, 1, 4.5, 5, 5, 5, 5.5, 2.5, 3, 3, 3.5, 3.5,
4, 4, 4.5, 7, 7, 7, 7.5, 7.5, 7.5, 8, 8, 8, 8.5, 8.5, 8.5, 9,
9, 9, 9.5, 9.5, 9.5, 10, 10, 10, 5.5, 5.5, 6, 6, 6, 6.5, 6.5,
6.5, 3.5, 4, 4, 4, 4.5, 4.5, 4.5, 5, 5, 5, 5.5, 5.5, 5.5, 6,
6, 6, 6.5, 6.5, 7, 7, 7.5, 7.5, 8, 8, 8.5, 8.5, 9, 9, 9, 9.5,
9.5, 9.5, 2.5, 2.5, 3, 3, 3, 3.5, 3.5, 10, 10), pst.flg = structure(c(3L,
1L, 3L, 2L, 2L, 3L, 2L, 2L, 3L, 2L, 3L, 2L, 2L, 2L, 2L, 3L, 3L,
1L, 2L, 3L, 1L, 3L, 2L, 3L, 2L, 3L, 2L, 3L, 2L, 1L, 2L, 3L, 1L,
2L, 3L, 1L, 2L, 3L, 1L, 2L, 3L, 1L, 2L, 3L, 1L, 2L, 3L, 1L, 2L,
3L, 2L, 3L, 1L, 2L, 3L, 1L, 2L, 3L, 3L, 1L, 2L, 3L, 1L, 2L, 3L,
1L, 2L, 3L, 1L, 2L, 3L, 1L, 2L, 3L, 1L, 3L, 1L, 3L, 1L, 3L, 1L,
3L, 1L, 3L, 1L, 2L, 3L, 1L, 2L, 3L, 2L, 3L, 1L, 2L, 3L, 1L, 2L,
1L, 3L), .Label = c("Graduated", "Enrolled", "Not Enrolled"), class = "factor"),
pct = c(20.7, 13.8, 20.7, 79.3, 93.1, 6.9, 79.3, 60, 40,
57.8, 42.2, 51.1, 100, 100, 88.9, 11.1, 57.8, 4.4, 37.8,
57.8, 15.6, 48.9, 40, 60, 42.2, 57.8, 42.2, 57.8, 42.2, 31.1,
8.9, 60, 33.3, 6.7, 60, 35.6, 4.4, 60, 35.6, 4.4, 60, 37.8,
2.2, 60, 37.8, 2.2, 60, 37.8, 2.2, 60, 24.4, 60, 24.4, 17.8,
57.8, 24.4, 15.6, 60, 17.2, 55.2, 24.1, 20.7, 55.2, 27.6,
17.2, 75.9, 6.9, 17.2, 79.3, 3.4, 17.2, 79.3, 3.4, 17.2,
82.8, 17.2, 82.8, 17.2, 82.8, 17.2, 82.8, 17.2, 82.8, 17.2,
82.8, 3.4, 13.8, 82.8, 3.4, 13.8, 65.5, 20.7, 41.4, 34.5,
24.1, 44.8, 37.9, 82.8, 17.2), pct.pos = c(89.65, 6.9, 89.65,
39.65, 46.55, 96.55, 39.65, 30, 80, 28.9, 78.9, 25.55, 50,
50, 44.45, 94.45, 71.1, 2.2, 23.3, 71.1, 7.8, 75.55, 20,
70, 21.1, 71.1, 21.1, 71.1, 21.1, 15.55, 35.55, 70, 16.65,
36.65, 70, 17.8, 37.8, 70, 17.8, 37.8, 70, 18.9, 38.9, 70,
18.9, 38.9, 70, 18.9, 38.9, 70, 27.8, 70, 12.2, 33.3, 71.1,
12.2, 32.2, 70, 91.3, 27.6, 67.25, 89.65, 27.6, 69, 91.4,
37.95, 79.35, 91.4, 39.65, 81, 91.3, 39.65, 81, 91.3, 41.4,
91.4, 41.4, 91.4, 41.4, 91.4, 41.4, 91.4, 41.4, 91.4, 41.4,
84.5, 93.1, 41.4, 84.5, 93.1, 46.55, 89.65, 20.7, 58.65,
87.95, 22.4, 63.75, 41.4, 91.4)), class = "data.frame", row.names = c(NA,
-99L), .Names = c("coh", "coh.termAbbr", "years", "pst.flg",
"pct", "pct.pos"))

Ben Bond-Lamberty
--
--
You received this message because you are subscribed to the ggplot2 mailing list.
Please provide a reproducible example: https://github.com/hadley/devtools/wiki/Reproducibility
To post: email ggp...@googlegroups.com
To unsubscribe: email ggplot2+u...@googlegroups.com
More options: http://groups.google.com/group/ggplot2
---
You received this message because you are subscribed to the Google Groups "ggplot2" group.
To unsubscribe from this group and stop receiving emails from it, send an email to ggplot2+u...@googlegroups.com.
For more options, visit https://groups.google.com/d/optout.