Combining Marimekko/Mosaic plot using ggplot2
155 views
Skip to first unread message

DrunkenPhD
Nov 10, 2015, 11:13:32 AM11/10/15
to ggplot2
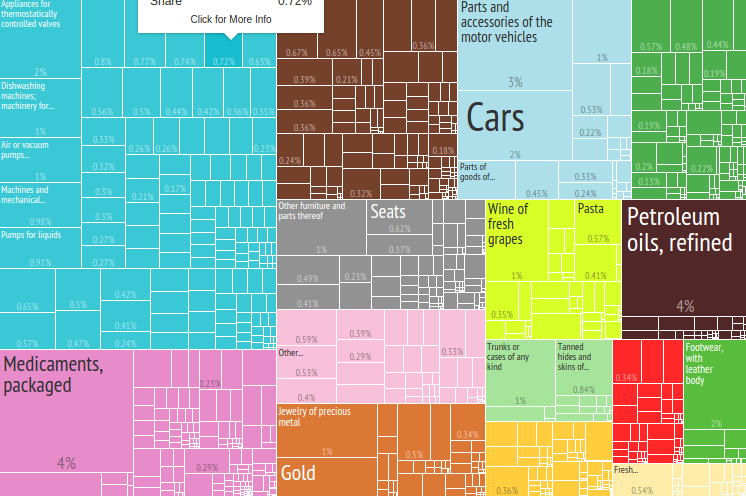
The Marimekko/Mosaic plot looks very nice when it comes to categorical data.
Even better when you can have categories inside categories like in the chart attached with the post.
ggplot package seems to have the power to do this but I am not quite sure if I should make facet_wrap for categories and use mosaic plots or there is any shortcut way?
What is the best way to create these using ggplot?
I am using dataset which you can find attached
Best Regards

Richard Zijdeman
Nov 10, 2015, 11:34:02 AM11/10/15
to DrunkenPhD, ggplot2
don’t forget to checkout the treemap package for these kinds of plots: https://github.com/mtennekes/treemap (also available via CRAN)
Best, Richard
--
Dr. R.L. Zijdeman | CDO | International Institute of Social History | Cruquiusweg 31 | 1019 AT Amsterdam | +31 20 668 5 866
--
--
You received this message because you are subscribed to the ggplot2 mailing list.
Please provide a reproducible example: https://github.com/hadley/devtools/wiki/Reproducibility
To post: email ggp...@googlegroups.com
To unsubscribe: email ggplot2+u...@googlegroups.com
More options: http://groups.google.com/group/ggplot2
---
You received this message because you are subscribed to the Google Groups "ggplot2" group.
To unsubscribe from this group and stop receiving emails from it, send an email to ggplot2+u...@googlegroups.com.
For more options, visit https://groups.google.com/d/optout.
<Book1.xlsx><Selection.png>
Reply all
Reply to author
Forward
0 new messages