drawing maps with ggplot2 in R
75 views
Skip to first unread message

mokoena france
Jul 14, 2016, 5:58:03 AM7/14/16
to ggplot2
Hi all,
I am very new in using ggplot2 package. I have a text file that has two columns containing the coordinates (lon, lat) and four columns containing data. I want to make four maps on a 2x2 panel with one common legend/key. Please assist how to achieve this goal.
--
Kind Regards
Mokoena France
Mobile: +266 59070225
"Even the youths shall faint and be weary, And the young men shall utterly
fall, But those who wait on the Lord Shall renew *their* strength; They
shall mount up with wings like eagles, They shall run and not be weary,They
shall walk and not faint." Isaish 40:30-31 NKJV

Brandon Hurr
Jul 14, 2016, 8:47:47 AM7/14/16
to mokoena france, ggplot2
If you can, post your data and give us something more to go on. If you can't post your real data, make up some fake data that is similar or recode it.
You should look at D. Kahle's ggmap package as a starter.
I suspect you will need to use facet_grid() to get your 2x2 maps for comparison across two factors.
We can get no further without data.
HTH,
B
--
--
You received this message because you are subscribed to the ggplot2 mailing list.
Please provide a reproducible example: https://github.com/hadley/devtools/wiki/Reproducibility
To post: email ggp...@googlegroups.com
To unsubscribe: email ggplot2+u...@googlegroups.com
More options: http://groups.google.com/group/ggplot2
---
You received this message because you are subscribed to the Google Groups "ggplot2" group.
To unsubscribe from this group and stop receiving emails from it, send an email to ggplot2+u...@googlegroups.com.
For more options, visit https://groups.google.com/d/optout.
Brandon Hurr
Jul 14, 2016, 10:38:50 AM7/14/16
to mokoena france, ggplot2
Mokoena,
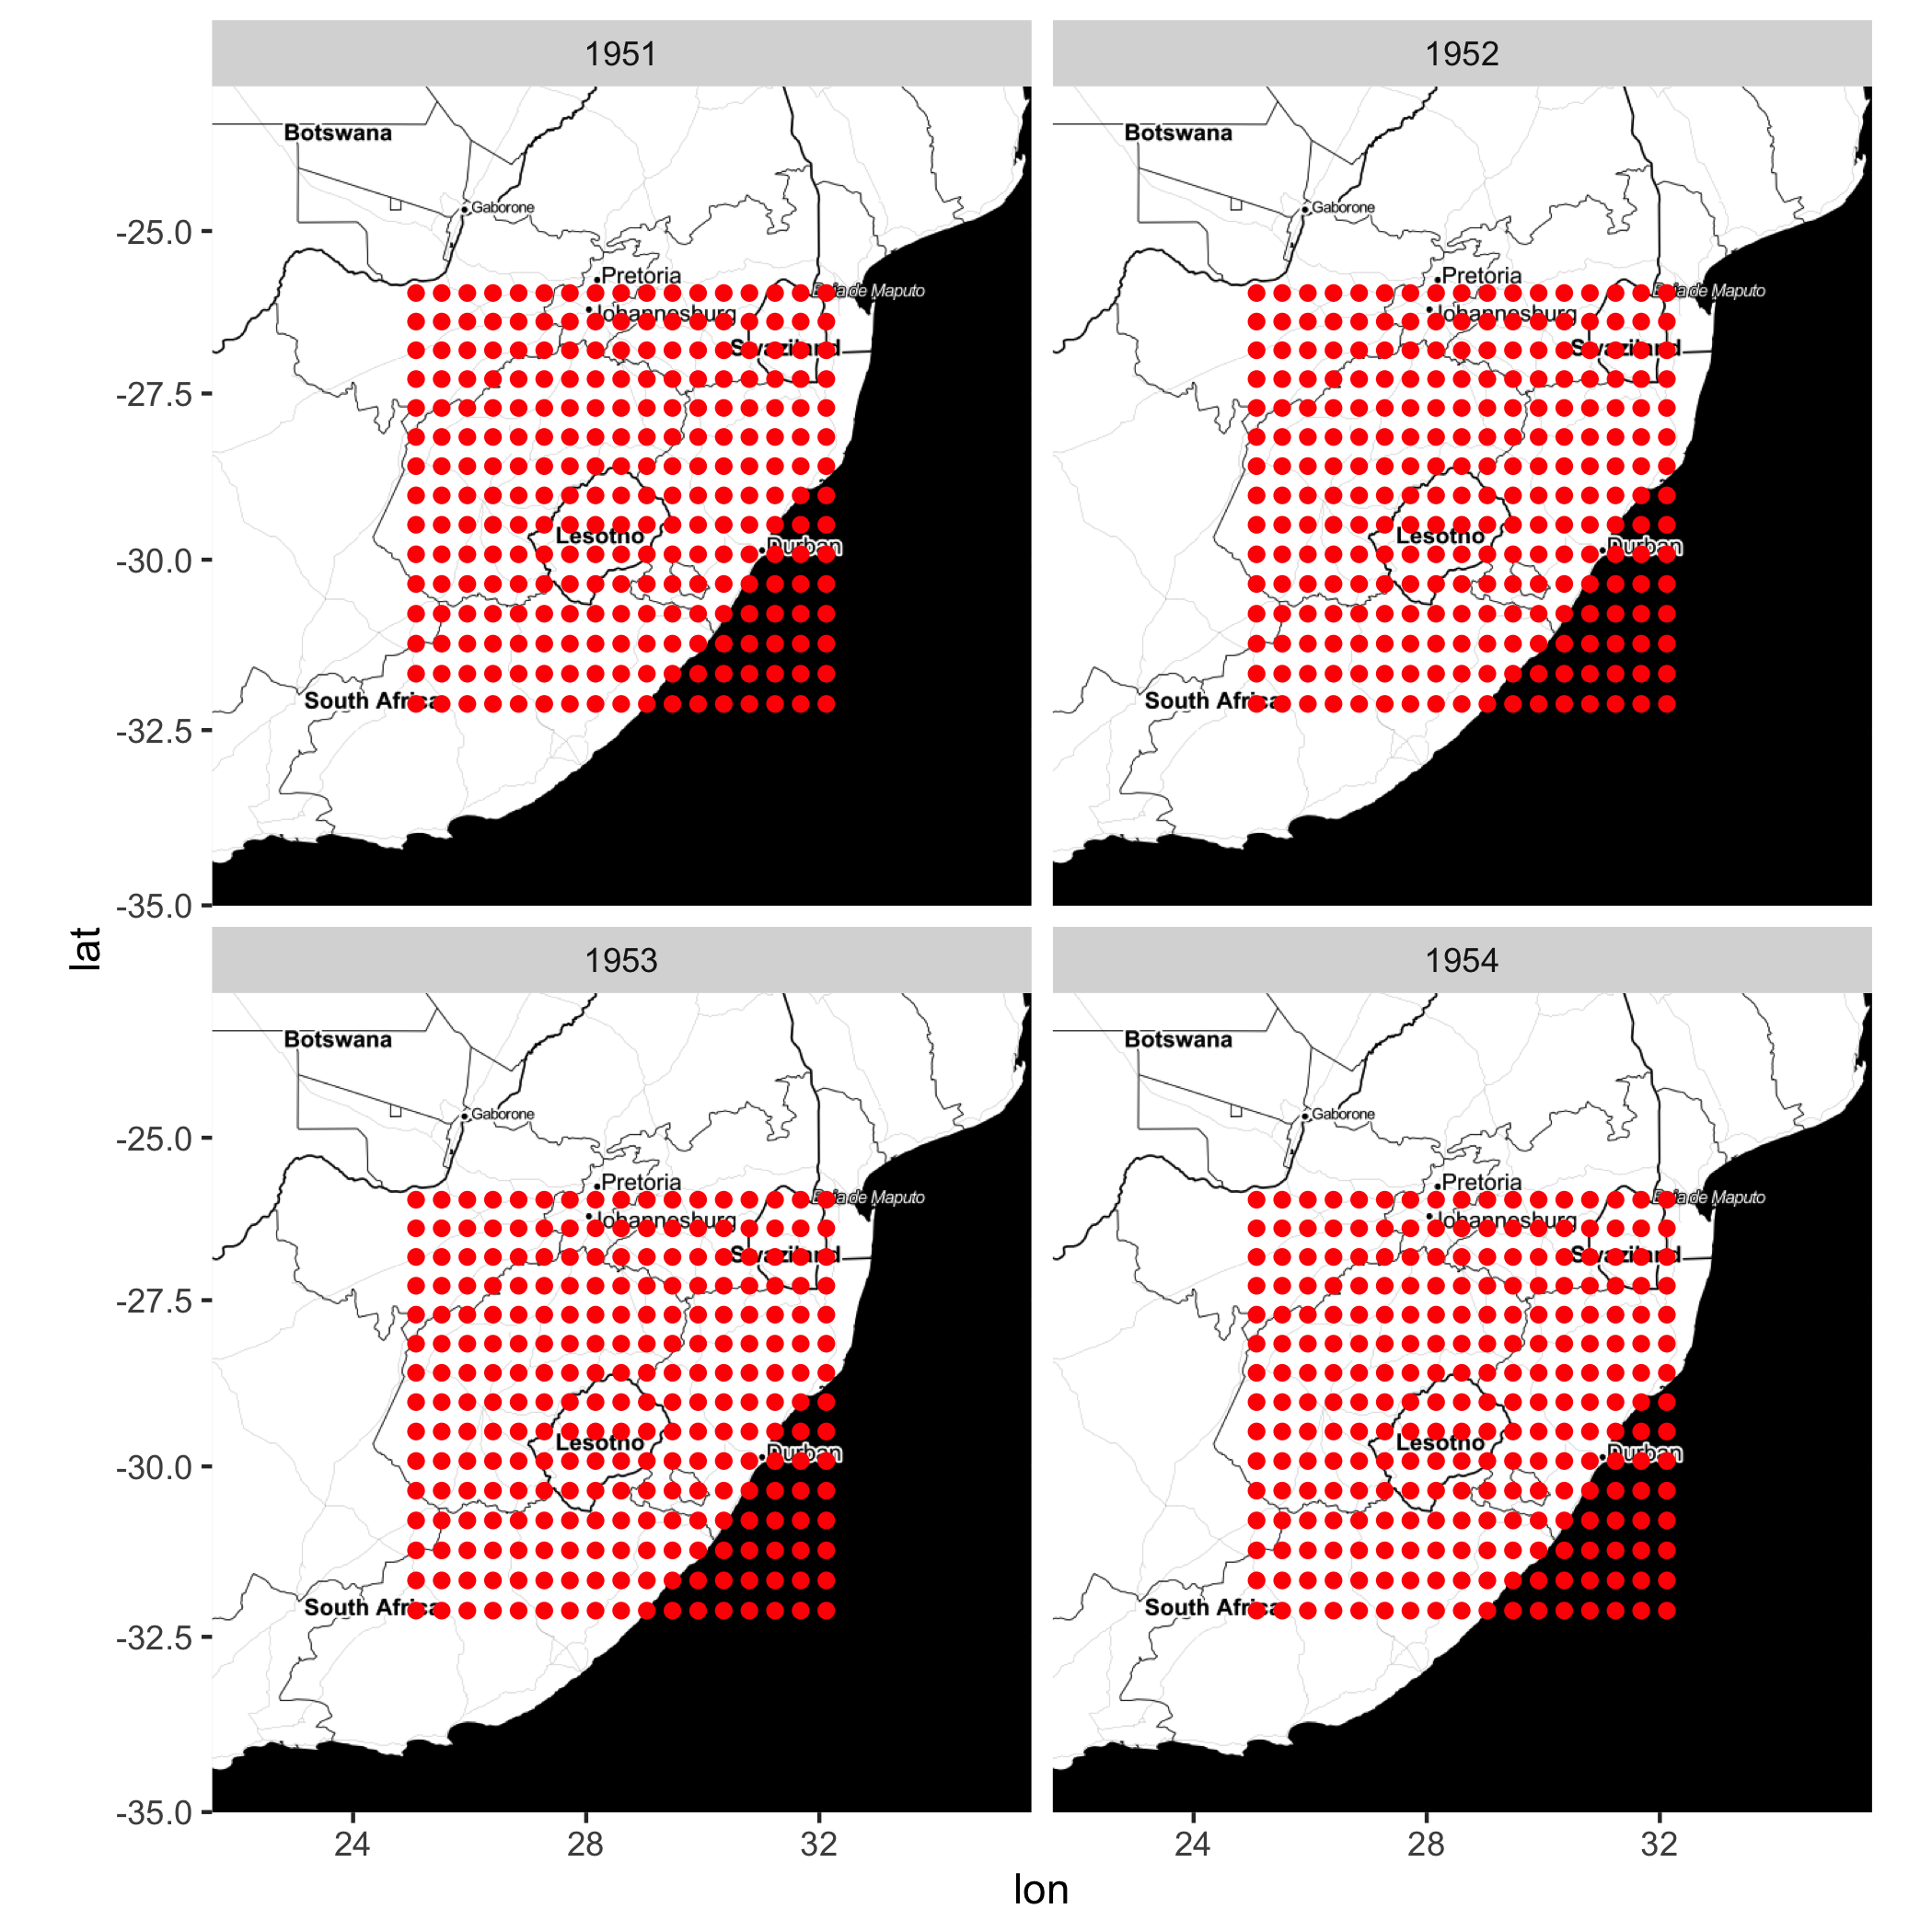
I plotted the data you gave me and it just looks like a grid of dots centered over Lesotho. I hope this is what you intended.
library(readr)
library(tidyr)
library(dplyr) #library(magrittr) really just need the pipe
library(ggplot2)
library(ggmap)
mapdata <- read_csv("~/Downloads/test.csv") %>%
gather(Year, Value, -lon, -lat) #gather up years
map <- get_map(location= c(lon=mean(mapdata$lon), lat = mean(mapdata$lat)), zoom = 6, maptype = "toner", source = "stamen")
ggmap(map) +
geom_point(data = mapdata, aes(x=lon, y=lat), color = "red") +
facet_wrap(~Year, ncol=2)
Reply all
Reply to author
Forward
0 new messages