ggplot2 - curveGrob - annotation_custom
78 views
Skip to first unread message

milena stat
Jan 20, 2016, 4:15:41 PM1/20/16
to ggplot2
Dear GGPLOT2 users,
I am struggling to understand a problem I encounter with use of curveGrob and annotation_custom command in ggplot.
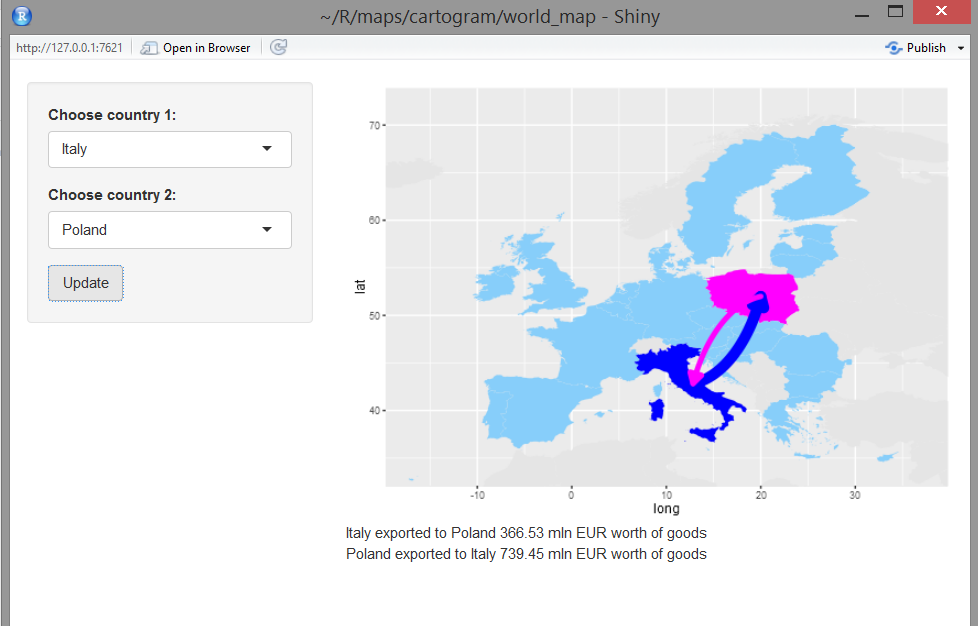
I am building a shiny application (like in shiny_pic.png).
after choosing country 1 and country 2, R would plot a map of Europe,
highlight the two selected countries with different colors
and draw a curved arrow from country 1 in its respective color towards country2
and vice versa from country 2 to country 1 in the color of country 2.
size of the arrow would correspond with trade between the two countries.
since it is a shiny application I need a code that works fast.
map does not have to be beautiful, the speed of the application is a priority.
for the curved arrows I tried geom_curve but either the arrow was not drawn at all
or would only appear after a wait for several minutes...
I searched stackoverflow and have found a very similar problem:
http://stackoverflow.com/questions/20216179/plot-curved-lines-between-two-locations-in-ggplot2
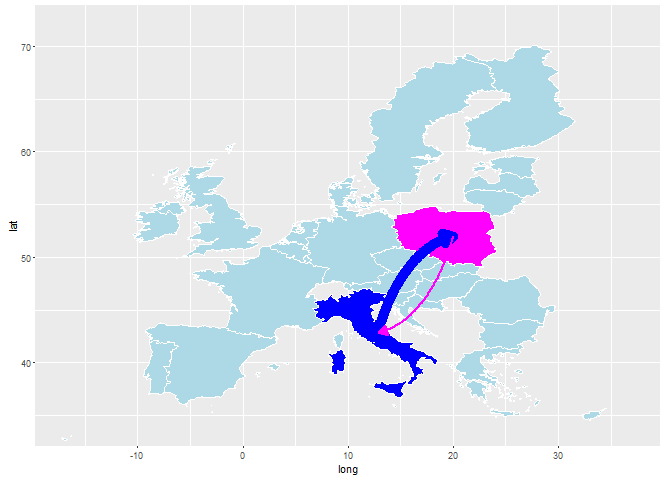
and although it works very well for a couple of countries like Italy-Poland
(the only thing I had to change inside curveGrov2(arrow(ends="first"))
for the arrow head to appear at the beginning, not the end.
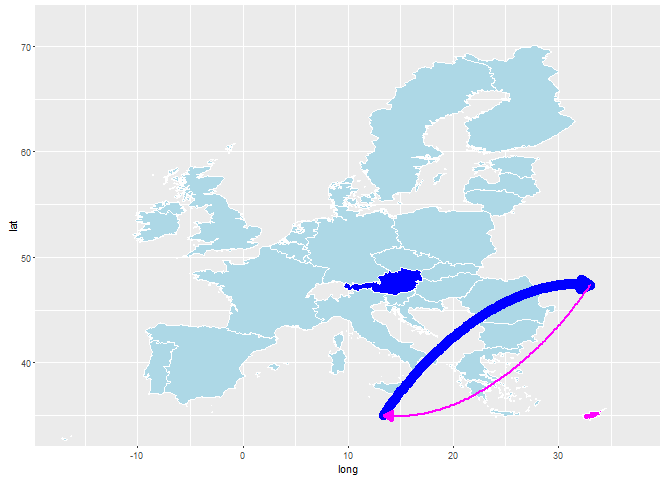
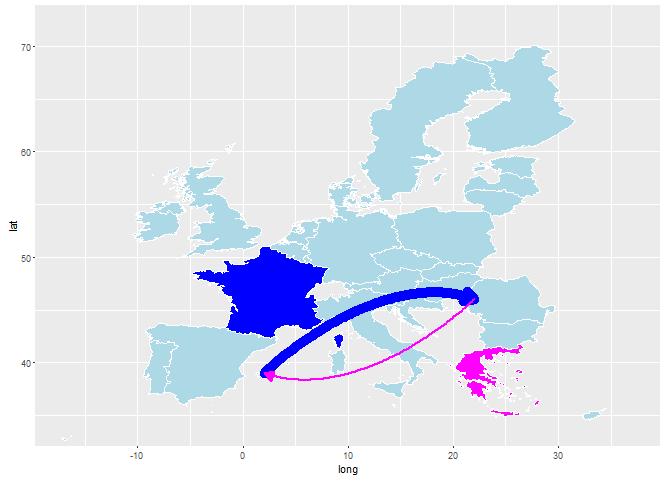
but the problem starts with country combinations like Austria-Cyprus or France-Greece.
It seems that x-coordinates are respected, but y-coordinates inverted
to draw an upward looking curve.
it has been a while that I am looking at this problem so perhaps I have lost a fresh eye.
is there some parameter I need to tweak in curveGrob function?
fyi: my map does not have to be plotted with ggplot2.
I am open to other solutions such as spplot etc.
as long as it works fast (shiny)
and draws the arrows as desired
with every country combination and code execution.
I would be grateful for any help and I am open to every feedback
if there is something I can improve in my code please fell free...
Milena
aka suzukiblue
require(grid)
g<-qplot(c(0,10),c(0,10))
myCurve<-curveGrob(0, 0, 1, 1, default.units = "npc",
curvature = 0.3, angle = 90, ncp = 20, shape = 1,
square = FALSE, squareShape = 1,
inflect = FALSE, arrow = arrow(), open = TRUE,
debug = FALSE,
name = NULL, gp = gpar(col="blue"), vp = NULL)
myCurve2<-curveGrob(0, 0, 1, 1, default.units = "npc",
curvature = -0.3, angle = 60, ncp = 10, shape = 1,
square = FALSE, squareShape = 1,
inflect = FALSE, arrow = arrow(), open = TRUE,
debug = FALSE,
name = NULL, gp = gpar(), vp = NULL)
g +
annotation_custom(grob=myCurve,0,10,0,10) + # plot from 0,0 to 10,10
annotation_custom(grob=myCurve,5,10,5,0) + # !!!!!this should draw from (5,5) to (10,0) but it does not
annotation_custom(grob=myCurve2,2.5,6,2.5,10) # plot from 2.5,2.5 to 6,6
I am struggling to understand a problem I encounter with use of curveGrob and annotation_custom command in ggplot.
I am building a shiny application (like in shiny_pic.png).
after choosing country 1 and country 2, R would plot a map of Europe,
highlight the two selected countries with different colors
and draw a curved arrow from country 1 in its respective color towards country2
and vice versa from country 2 to country 1 in the color of country 2.
size of the arrow would correspond with trade between the two countries.
since it is a shiny application I need a code that works fast.
map does not have to be beautiful, the speed of the application is a priority.
for the curved arrows I tried geom_curve but either the arrow was not drawn at all
or would only appear after a wait for several minutes...
I searched stackoverflow and have found a very similar problem:
http://stackoverflow.com/questions/20216179/plot-curved-lines-between-two-locations-in-ggplot2
and although it works very well for a couple of countries like Italy-Poland
(the only thing I had to change inside curveGrov2(arrow(ends="first"))
for the arrow head to appear at the beginning, not the end.
but the problem starts with country combinations like Austria-Cyprus or France-Greece.
It seems that x-coordinates are respected, but y-coordinates inverted
to draw an upward looking curve.
it has been a while that I am looking at this problem so perhaps I have lost a fresh eye.
is there some parameter I need to tweak in curveGrob function?
fyi: my map does not have to be plotted with ggplot2.
I am open to other solutions such as spplot etc.
as long as it works fast (shiny)
and draws the arrows as desired
with every country combination and code execution.
I would be grateful for any help and I am open to every feedback
if there is something I can improve in my code please fell free...
Milena
aka suzukiblue
require(grid)
g<-qplot(c(0,10),c(0,10))
myCurve<-curveGrob(0, 0, 1, 1, default.units = "npc",
curvature = 0.3, angle = 90, ncp = 20, shape = 1,
square = FALSE, squareShape = 1,
inflect = FALSE, arrow = arrow(), open = TRUE,
debug = FALSE,
name = NULL, gp = gpar(col="blue"), vp = NULL)
myCurve2<-curveGrob(0, 0, 1, 1, default.units = "npc",
curvature = -0.3, angle = 60, ncp = 10, shape = 1,
square = FALSE, squareShape = 1,
inflect = FALSE, arrow = arrow(), open = TRUE,
debug = FALSE,
name = NULL, gp = gpar(), vp = NULL)
g +
annotation_custom(grob=myCurve,0,10,0,10) + # plot from 0,0 to 10,10
annotation_custom(grob=myCurve,5,10,5,0) + # !!!!!this should draw from (5,5) to (10,0) but it does not
annotation_custom(grob=myCurve2,2.5,6,2.5,10) # plot from 2.5,2.5 to 6,6
Reply all
Reply to author
Forward
0 new messages